Inflation Nation: Pressure builds, underwater beach ball
Last week’s excessive CPI print marked the top of the S&P 500 for the week. As the market continues to digest the data, where is the breaking point for inflation and interest rates?
Did you watch Fed Chair Powell testify in front of the Senate and House last week? It seemed to be like watching certain angry congresspeople calling for interest rates to be kept lower for longer. Do they want hyperinflation? Other groups of Senators reflected on what the inflationary environment was like in the early 1980s.
As Chair Powell testified, bonds rose (yields fell), and the S&P 500 was mostly lower. Clearly, there was a bid under the bonds (keeping interest rates lower). All of this came over a two-day period following the monstrous CPI print.
Recapping Tuesday through Friday in the E-Mini S&P 500 Futures Last Week:
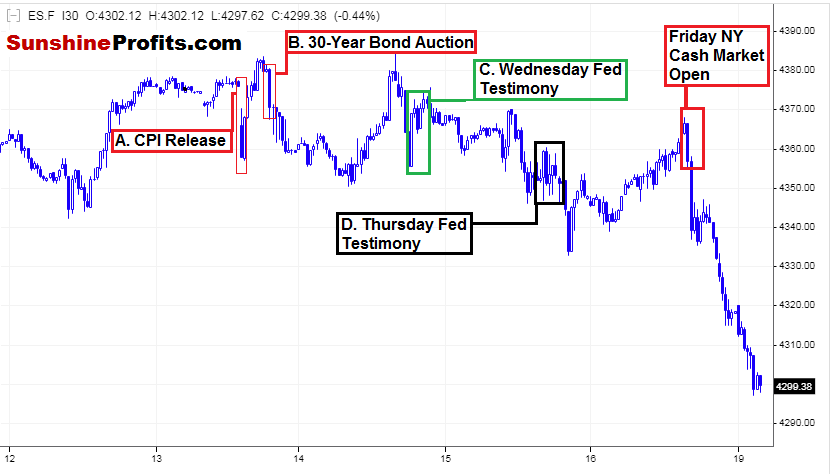
Figure 1 - E-Mini S&P 500 Futures July 12, 2021 - July 16, 2021, 10:00 PM ET, 30 Minute Candles Source stooq.com
A. Tuesday 8:30 AM: CPI Data 0.9% vs. 0.5% expected, highest run rate ex-food and energy in 30 years.
B. Tuesday 1:00 PM: Weak 30-Year bond auction offered at 2.00% yield.
C. Wednesday: Fed Chair testimony.
D. Thursday: Fed Chair testimony.
E. Friday: NY Cash Market Open.
We can see the large CPI print was bearish for the index, and the market recovered. Then, we had the bond auction, which had very weak demand at 2.00%, and the index sold off again. It recovered once again, tested the highs, and was rejected. The Fed testimonies on Wednesday and Thursday kept the S&P 500 bid and sideways.
As all of this was occurring last week, I was eyeballing the index all day, each day, wondering when it would all become too much to keep the index afloat.
On Friday, we got a bullish Retail Sales number at 8:30 AM before the NY cash open, and then a bearish UoM Consumer Sentiment Print at 10:00 AM. The NY open was lower even before the bearish UoM print at 10:00 AM. It seemed like the index finally couldn’t bear the inflation data. The weak bond auction, and the congressional rhetoric during the Fed 2-day testimony any further and had to break. It actually made sense.
I want to illustrate the above A through E points in terms of interest rates last week.
Taking a look in terms of the 10-Year note yield:
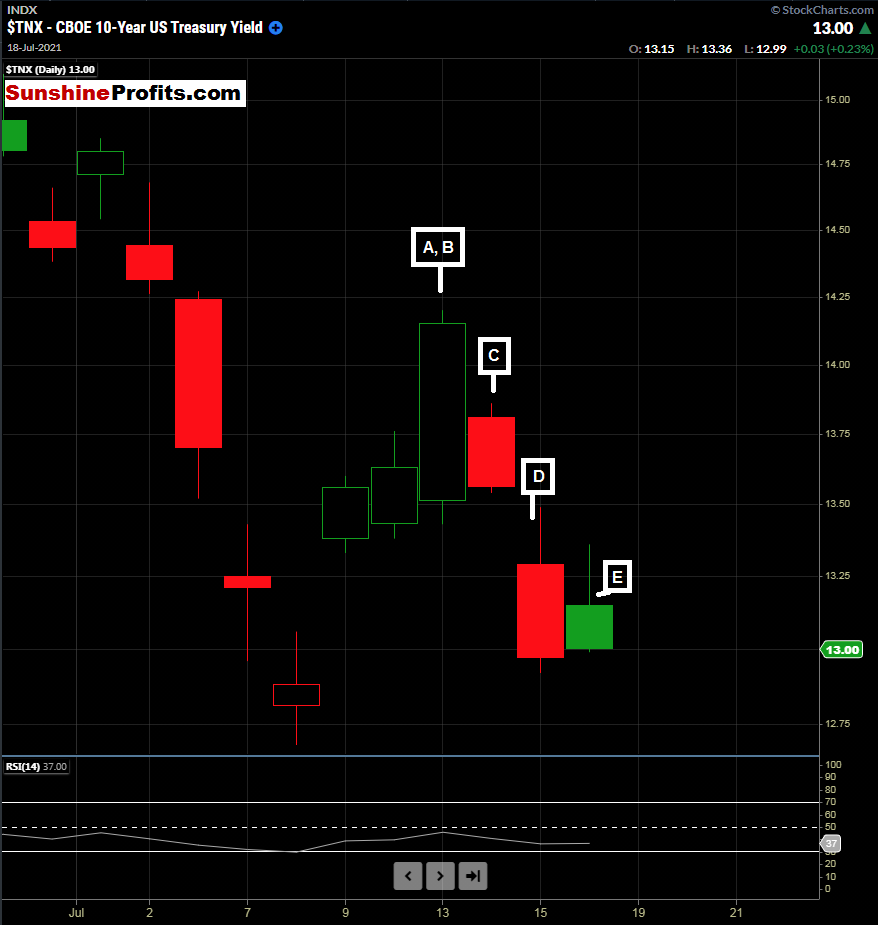
Figure 2 - 10-Year Treasury Yield July 12, 2021 - July 16, 2021, Daily Candles Source stockcharts.com
The question I pose here: What if interest rates were rising towards the end of last week?
It doesn’t seem like the current market would be able to handle it. However, the Fed must use tools to curb inflation. This inflation seems anything but transitory or temporary at this point.
If bond yields were going higher on Friday with the market lower, how much would the INdex have dropped? That is the million-dollar question.
Rates do need to rise. But, if the Fed is not going to begin tapering (slowing bond purchases) or raising rates incrementally, what will happen with inflation?
If you hold a beach ball underwater, it eventually will pop up. You can’t keep it underwater forever.
This is food for thought as we begin the week.
Want free follow-ups to the above article and details not available to 99%+ investors? Sign up to our free newsletter today!
Premium
You have reached your limit of 3 free articles for this month.
Start your subscription and get access to all our original articles.
Author

Rafael Zorabedian
Sunshine Profits
After spending years as an active trader across several capital markets, Rafael earned his stripes as a former futures and options broker specializing in equity indices, energies, metals, and soft commodities.


