|

IBEX 35 Shows Short-Term Exhaustion Signals

The IBEX 35, in its hourly chart, shows the breakdown of an ascending wedge, which gives us a signal of exhaustion of the short-term bullish sequence started on January 31st at 9,334 pts.

IBEX

On the other hand, the bearish divergence exhibited by the oscillator confirms the exhaustion signal of the ascending wedge pattern. However, divergence is not a guarantee of the reversal movement; it requires confirmation by price action.

A short position will activate if the price breaks and closes below 9,972 pts, just below the last low of the ascending wedge. In our conservative scenario, the Spanish index could drop until 9,866 pts. If the market action increases its bearish momentum, the IBEX could extend its falls until 9,759 pts, and even plummet till 9,563 pts.

The invalidation level of our bearish scenario is placed at 10,104 pts, which is slightly above the last top of the short-term upside.

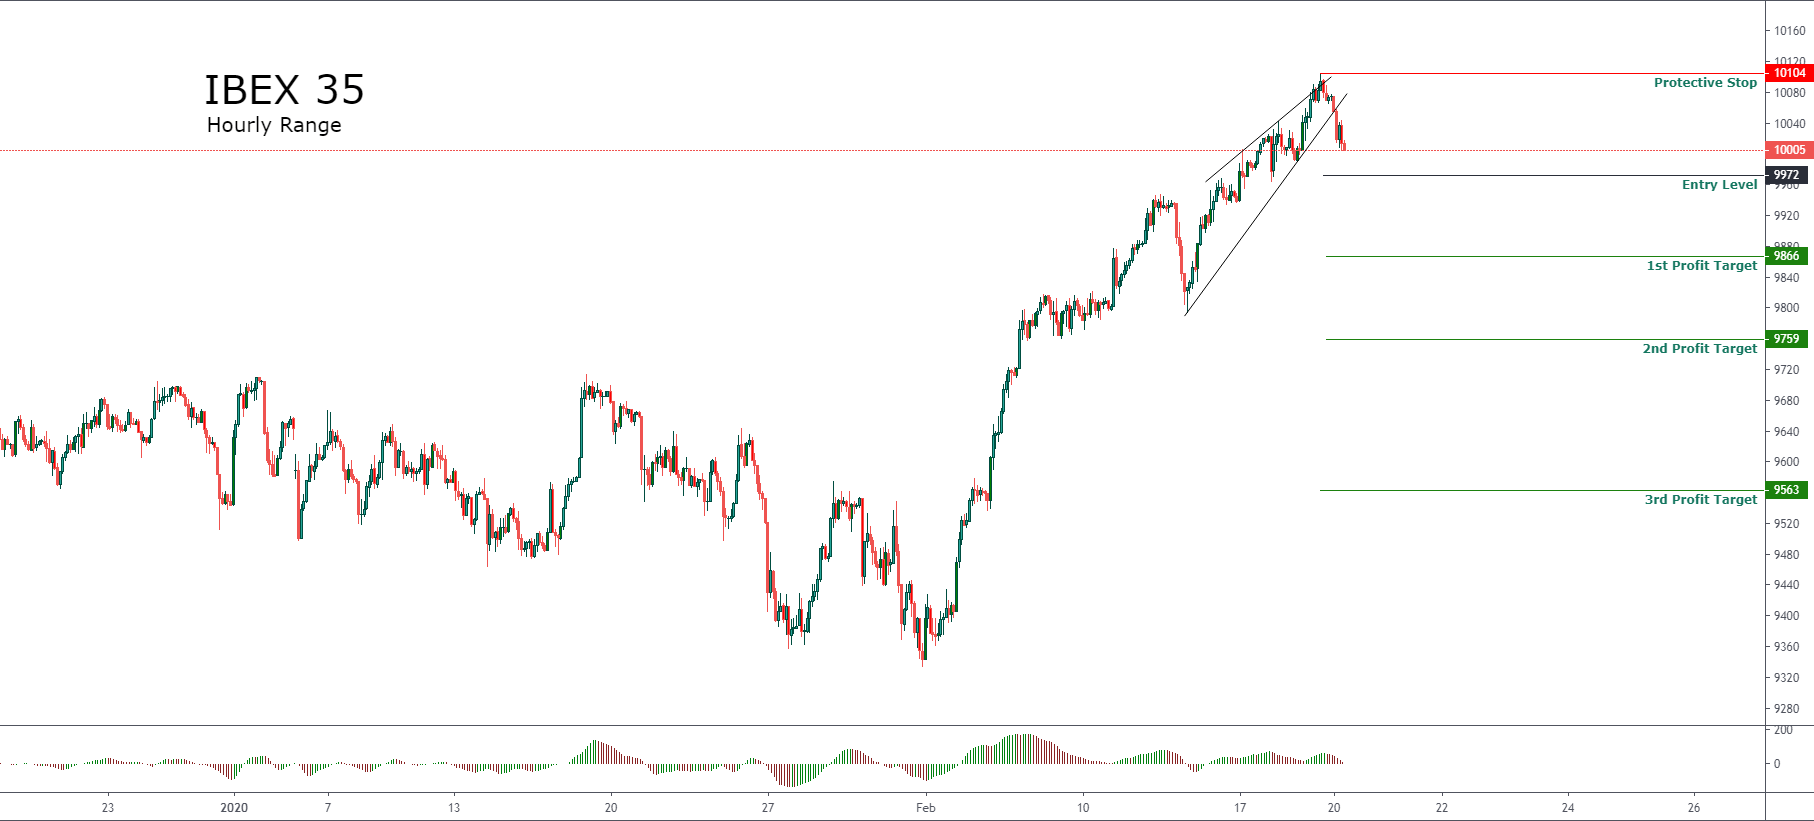
Trading Plan Summary

Entry Level: 9,972 pts.

Protective Stop: 10,104 pts.

1st Profit Target: 9,866 pts.

2nd Profit Target: 9,759 pts.

3rd Profit Target: 9,563 pts.


Try Secure Leveraged Trading with EagleFX!

Author

EagleFX Team

EagleFX Team is an international group of market analysts with skills in fundamental and technical analysis, applying several methods to assess the state and likelihood of price movements on Forex, Commodities, Indices, Metals and

More from EagleFX Team
Share:

Editor's Picks

EUR/USD extends its optimism past 1.1900

EUR/USD retains a firm underlying bid, surpassing the 1.1900 mark as the NA session draws to a close on Monday. The pair’s persistent uptrend comes as the US Dollar remains on the defensive, with traders staying cautious ahead of upcoming US NFP prints and CPI data.
 

GBP/USD tilts bullish as markets barrel toward mid-week NFP print

GBP/USD is holding a broader bullish structure on the daily chart, with price trading well above the 50 Exponential Moving Average at 1.3507 and the 200 EMA at 1.3310, confirming the intermediate uptrend that has been in place since the November 2025 low near 1.2300. 

Gold pushes back above $5,000

The daily chart shows spot Gold in a parabolic uptrend that accelerated sharply from the $4,600 area in late January, printing a record high at $5,598.25 before a violent reversal erased nearly $1,000 in value during the final days of the month. 

Litecoin eyes $50 as heavy losses weigh on investors

Following a strong downtrend across the crypto market over the past week, Litecoin holders are under immense pressure. The Bitcoin fork has trimmed about $1.81 billion from its market capitalization since the beginning of the year, sending it below the top 20 cryptos by market cap.

Japanese PM Takaichi nabs unprecedented victory – US data eyed this week

I do not think I would be exaggerating to say that Japanese Prime Minister Sanae Takaichi’s snap general election gamble paid off over the weekend – and then some. This secured the Liberal Democratic Party (LDP) an unprecedented mandate just three months into her tenure.

Ripple exposed to volatility amid low retail interest, modest fund inflows

Ripple (XRP) is extending its intraday decline to around $1.40 at the time of writing on Monday amid growing pressure from the retail market and risk-off sentiment that continues to keep investors on the sidelines.