|

How to use volume spread analysis as a timing tool in S&P 500 day trading [Video]

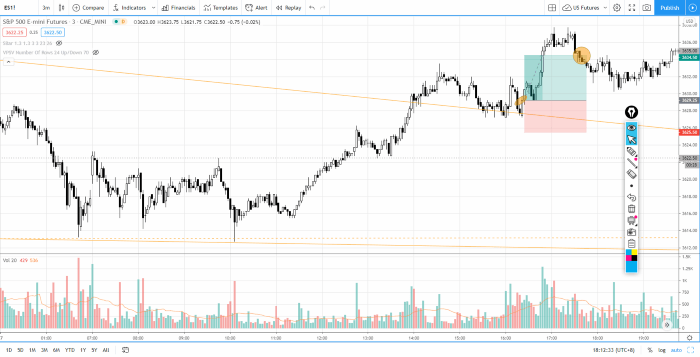
Find out how you can use volume spread analysis to time the market when day trading S&P 500 futures (ES) in the trade review section.

Check out the video for a complete walk through of the daily market analysis of S&P 500 futures (ES) for 30 Nov 2020 trading session. In this video, you will find out the market recap during the last session and a trade review in the three-minutes timeframe (including entry, exit and the rationale behind). Going forward, I will cover the bias, the key levels to pay attention to, my trading plan for the session later.

Watch my daily market analysis video in the last session if you haven’t in order to better relate to the market recap and the trade review.

Bias — neutral (Day trading); bullish (long term)

Key levels — Resistance: 3640, 3660; Support: 3600, 3587

Potential setup — Look for potential reversal at the key levels.
SP500

Author

Ming Jong Tey

Ming Jong Tey

Independent Analyst

Ming Jong Tey has been trading since 2008. He started his learning journey from technical analysis (indicators, Fibonacci, etc...) to value investing. Throughout his journey, he develops an interest in price action with chart pattern trading.


More from Ming Jong Tey
Share:

Editor's Picks

AUD/USD defies gravity; focus is back to 0.7000

AUD/USD has maintained its bid bias around 0.6970 ahead of the opening bell in Asia on Tuesday. The pair has added to Friday’s rebound, retargeting the 0.7000 hurdle despite another day of firm gains in the Greenback. Looking ahead, Westpac will publish its Consumer Confidence gauge on the domestic calendar.

USD/JPY retakes 158.00 amid hawkish BoJ bets, firmer USD

USD/JPY erases losses and retakes 158.00 in the Asian session on Monday, trading within a one-week-old range. Geopolitical uncertainty continues to underpin the US Dollar, despite fading Fed rate hike hopes, supporting the pair's rebound. However, further upside could be capped by hawkish BoJ expectations and looming intervention risks that could support the Japanese Yen.

Gold treads water around $4,150

Gold now regains some composure and approaches the $4,150 mark per troy ounce late on Monday. The precious metal’s vacillating price action comes in response to the persistent advance in the US Dollar in combination with the resurgence of the upside momentum in US Treasury yields across the curve.

Bitcoin and Gold Outlook: BTC slips, XAU downtrend persists as US Services PMI misses forecasts
Bitcoin (BTC) faces growing headwinds on Monday, as it trades lower below $86,000. Despite the ongoing pullback, the Crypto King remains in a broad range with the lower limit near $84,000 and the upper limit at $88,000. A break on either side of this zone would influence BTC's direction. Gold (XAU/USD), meanwhile, retains a dominant bearish outlook as price action continues downward toward $4,100.
Eurozone inflation just hit 3.8%, its highest in three years. This chart shows why the ECB can’t simply hike its way out

The ECB would normally have a relatively straightforward answer to inflation running almost twice its target: raise interest rates. But these are not normal circumstances. This time, the bond market is already doing part of the tightening for it, leaving the ECB facing an increasingly difficult dilemma.

Eurozone inflation just hit 3.8%, its highest in three years. This chart shows why the ECB can’t simply hike its way out

The ECB would normally have a relatively straightforward answer to inflation running almost twice its target: raise interest rates. But these are not normal circumstances. This time, the bond market is already doing part of the tightening for it, leaving the ECB facing an increasingly difficult dilemma.














