How to trade the Canadian GDP with USD/CAD
- The GDP report provides a broad overview of the economy and impacts the Canadian Dollar.
- The Market Impact Tool shows trading opportunities in both upside and downside surprises on this event.
- The USD/CAD moved, on average, 46 pips in the 15 minutes after the data release and 90 pips in the following 4 hours.

Selling USD/CAD Scenario
-
Tradable Positive Trigger: +1.53 deviation (2.25%) [SELL Pair]
-
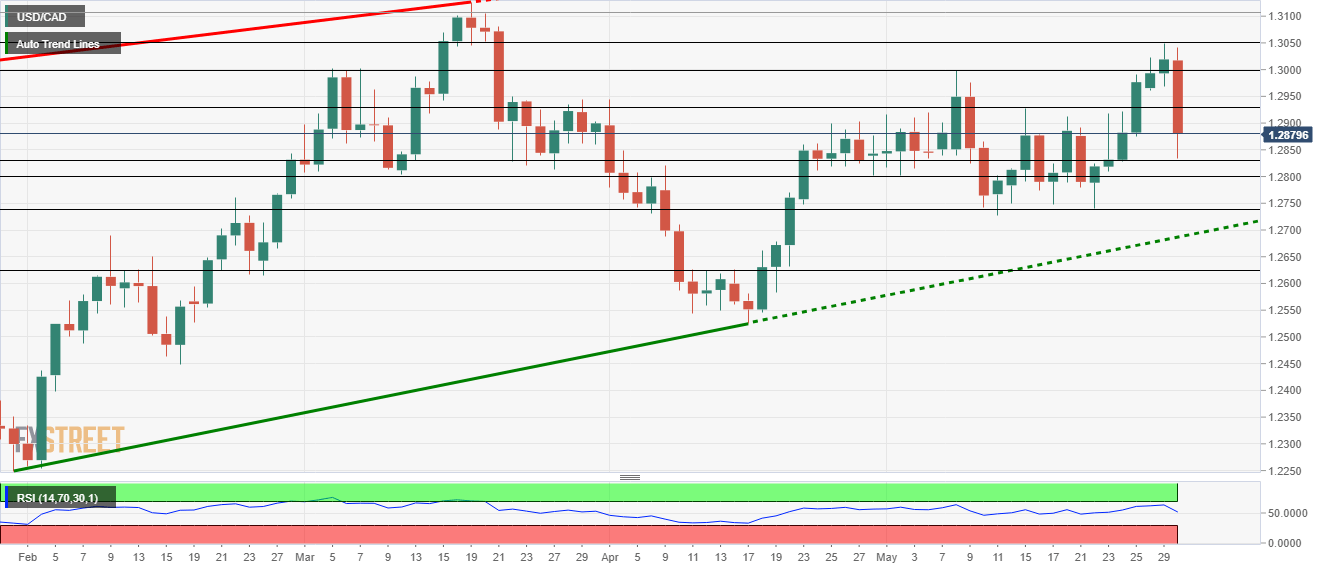
Key Support Level: 1.2800
This time, if it comes out at higher than expected with a relative deviation of +1.53 or higher (2.25% or higher in actual terms), the pair may go down reaching a range of 50 pips in the first 15 minutes and 91 pips in the following 4 hours.
1.2830 was the low point on May 30th. Further down, 1.2800 is a round number that also provided support in early May. The swing low of May 25th at 1.2735 is the next level to watch.
Buying USD/CAD Scenario
-
Tradable Negative Trigger: -1.06 deviation (1.31%) [BUY Pair]
-
Key Resistance Level: 1.2930
If it comes out lower than expected at a relative deviation of -1.06 or less (1.31% or lower in actual terms), the USD/CAD may go up reaching a range of 38 pips in the first 15 minutes and 66 pips in the following 4 hours.
1.2930 was a peak on May 15th and serves as resistance. The round number of 1.3000 also capped the pair on several occasions. 1.3050 was the recent swing high.
USD/CAD Levels on the Chart
More data
Canada's quarterly GDP rate for the first quarter of 2018 is expected to show modest growth as the winter hit the economy hard. Nevertheless, thick hints by the BOC about strong growth raise expectations.
See: Canadian GDP Forecast: Hopes are higher than they seem - can Canada deliver?
In the last five releases, the USD/CAD moved, on average, 46 pips in the 15 minutes after the data release and 90 pips in the following 4 hours.
The previous release had a negative surprise of -0.82 in terms of relative deviation and the USD/CAD reached a 25 pip range in the first 15 minutes and a range of 55 pips 4 hours thereafter.
Follow the publication of the figure on the economic calendar. Watch out for the data from the Market Impact tool, projecting the potential price changes according to the deviation. Here is the Market Impact Studies Users Guide.
Author

Yohay Elam
FXStreet
Yohay is in Forex since 2008 when he founded Forex Crunch, a blog crafted in his free time that turned into a fully-fledged currency website later sold to Finixio.


