How stressed are euro rates and credit markets?

Signs of stress are appearing everywhere in financial markets, so much so that it is fuelling hopes of a central bank pivot. Markets have been very bearish the past couple of weeks, and areas of weakness are being hunted out. We take a look at how bad things are in euro rates and credit markets.
Rates – a slow motion car crash
It is no mystery that trading conditions in most financial markets have worsened this year, and interest rates are no exception. Some assets embed in their pricing a number of risk premia that make their level a good enough indicator of market stress – think credit spreads for instance. Other assets are closer to what some still call risk-free – as if there was such a thing – and so impaired functioning is what one should look for.
In the first category, one key indicator is sovereign spreads. Taking the widely-used 10Y Italy-Germany spread benchmark as an example, peripheral bond market conditions can already be described as stressed. The subtlety here, and we think this is how the European Central Bank (ECB) ultimately looks at this, is that the speed of the adjustment higher has been much slower than in previous crises. It is precisely due to the ECB’s careful watch, and continued bond purchases, that the adjustment has been orderly. The upcoming debate on balance sheet reduction, also known as quantitative tightening (QT), risks scuppering this fragile equilibrium.
Sovereign spreads are widening in lockstep with higher core rates
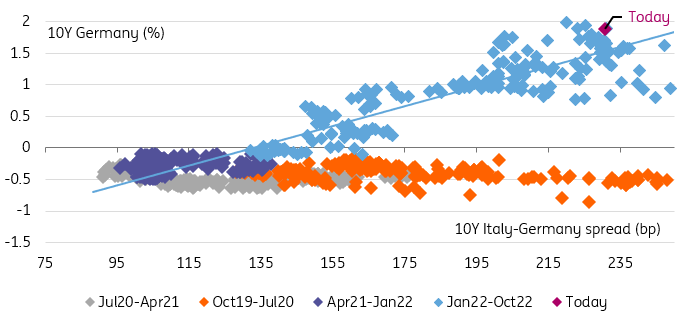
Source: Refinitiv, ING
Concerns are not just about riskier bonds, but also about the functioning of their ‘core’ counterparts. This matters because many assets price off interest rate curves, or interest rates are an input into their valuations. Here it is both the ability to actually trade, as well as the consistency of pricing, that matter. Both the trading cost and implied rate volatility in the options market are at record highs. This speaks to worsening liquidity conditions. Here too, the fact that the adjustment has occurred progressively this year has been used as a justification for sanguine reaction by policymakers, however.
Core bond market liquidity has worsened all year
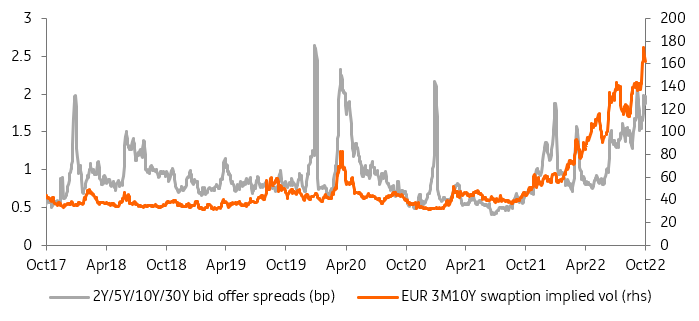
Source: Refinitiv, ING
Money markets – under the ECB’s thumb
Money markets have also been the centre of attention lately. Firstly, the collateral scarcity in some core markets is impeding the transmission of higher ECB rates to all corners of financial markets, and ultimately to the economy. This is a problem but not something we would immediately link to systemic risk. It does, however, contribute to a worsening of trading conditions in core rates (see the previous section). Should eurozone break-up risk flare up again, something the ECB has been actively working to prevent, a divergence in funding rates between eurozone member states would be one of the most striking consequences.
Collateral scarcity is impeding the transmission of ECB hikes
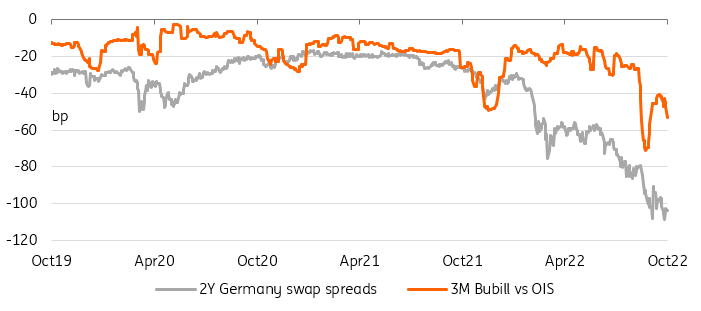
Source: Refinitiv, ING
Unsecured lending markets are often one of the first places where financial stress occurs, as the drying up of commercial paper (CP) liquidity and subsequent central bank interventions in the spring of 2020 have shown. Compared to swaps (OIS) we find that neither CP nor Euribor fixings have moved to levels indicating funding stress. There are a number of reasons for this. Firstly, the volatility of the underlying OIS might be drowning price signals of credit-sensitive markets. Secondly, the ECB’s excess liquidity comfort blanket is also supressing the cost of credit and of liquidity.
Unsecured funding rates are supressed by ECB liquidity
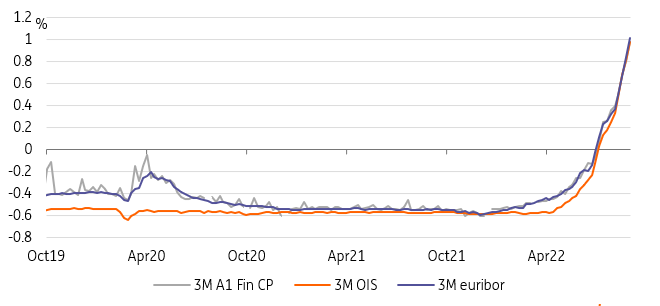
Source: Refinitiv, ING
Pause in bearish market as credit spreads bounce back
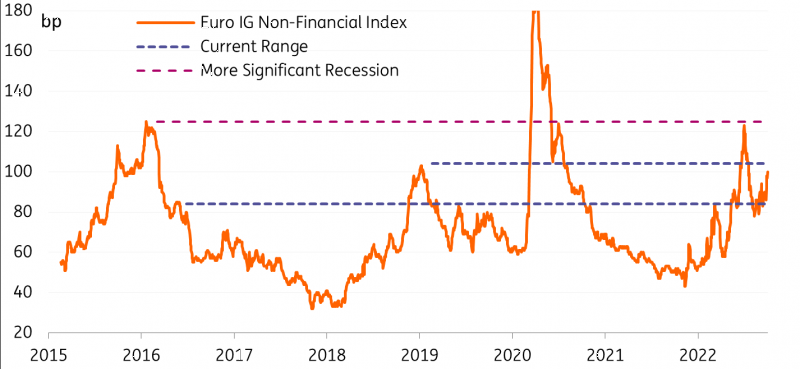
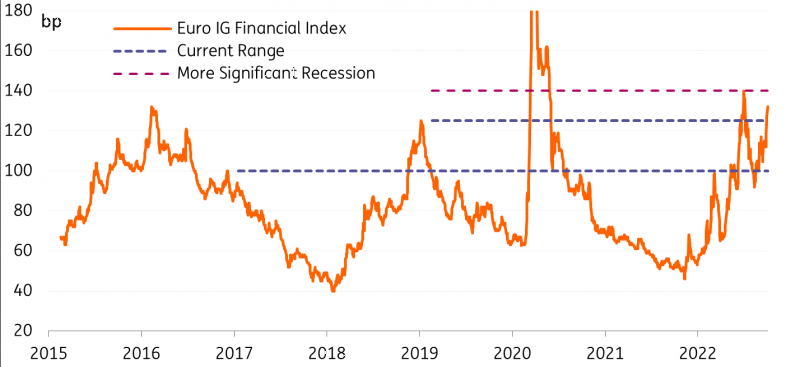
There was substantial spread widening over the past number of sessions in credit, with EUR non-financials spreads widening by 14bp and financials worse off, with 20bp widening since Tuesday last week. A small retracement yesterday of a couple of basis points as we bounce close to the high end of the range.
EUR IG non-financial range
Range between 84bp and 104bp – currently at 99bp
Source: ING, ICE
EUR IG financial range
Range between 100bp and 125bp – currently at 130bp
Source: ING, ICE
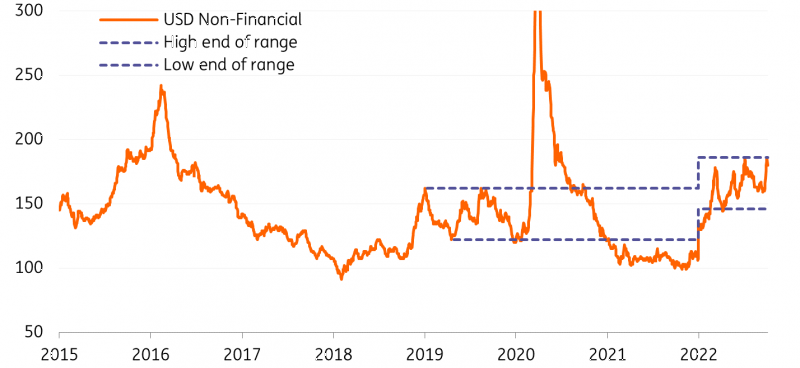
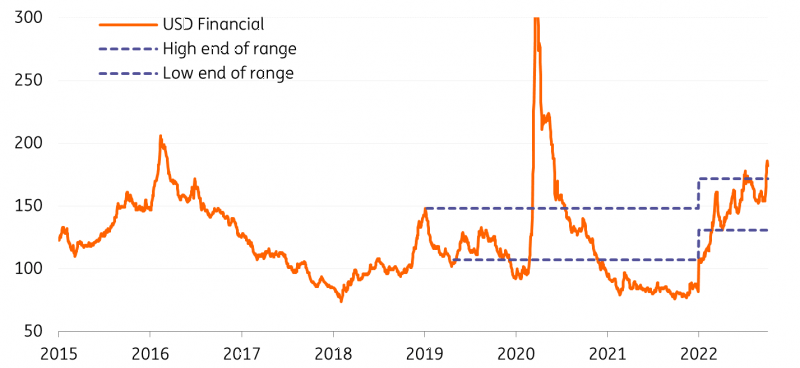
Similarly, USD non-financials have widened by 20bp over the past two weeks, now sitting at the top of the range, while financials overshot the range, widening 30bp. USD spreads subsequently retraced on Monday, by 8bp and 6bp respectively. The previous underperformance in USD has resulted in a major shift wider for the USD EUR differential.
USD IG non-financial range
Range between 146bp and 186bp – currently at 178bp
Source: ING, ICE
USD IG financial range
Range between 131bp and 172bp – currently at 180bp
Source: ING, ICE
We do except spreads will remain within this range, and spreads do look attractive at these high-end-of-the-range levels. But we still see many risks in the market and remain conservative as spreads are likely to test these high-end-of-the-range levels again.
The hunt for weakness within the bearish market
Systemic stresses combined with geopolitical unrest have created a truly bearish market. This risk-off market is leading to high volatility, a hunt for weakness and capitulation trades. Credit Suisse is a good case in point in the hunt for weakness. The sterling and gilts market is another case in point, when significant moves in rates triggered margin calls and further forced selling. Credit spread movements are therefore more severe due to investors needing to adjust positions rapidly amid this heightened volatility and an environment with forced selling.
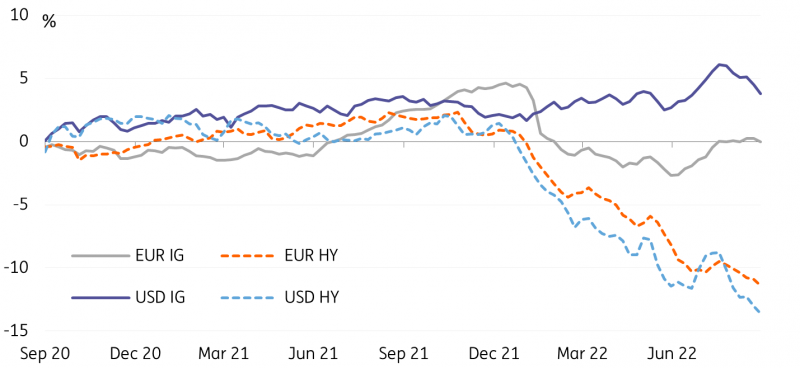
In addition, there were outflows of mutual funds across the board last week, with EUR IG funds outflowing by 0.2% and EUR HY outflowing by 0.5%. USD IG fund outflows were more severe at 0.7%, and USD HY outflows of 0.6%.
EUR and USD fund flows
Source: ING, EPFR
Funding costs at the highest in 10 years
The all-in cost of debt has risen rather significantly in recent months with both spreads widening and swap rates rising. The cost of debt is now at the highest levels seen in the past 10 years. Thus corporates can no longer avail of cheap funding. This is putting pressure on primary markets. Currently, most corporates are still sitting on large levels of cash on their balance sheets. In addition, there is little urgency for issuers to finance themselves at this particular point in time, as so much pre-funding was done between 2019-21. For now, this higher cost of debt is manageable, but it may not be as the cash buffer for corporates decreases due to high inflation, high energy costs and the looming recession putting earnings and margins under pressure. In particular, high-yield issuers may struggle to bring bonds at these high levels.
All-in cost has risen substantially – BBB
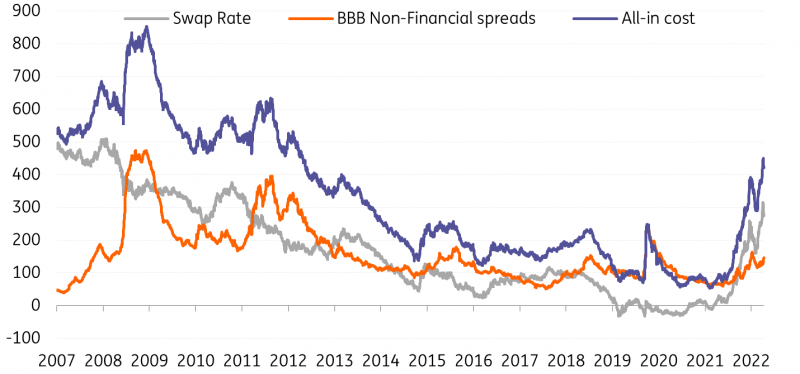
Source: ING, ICE, Refinitiv
All-in cost has risen substantially – BB
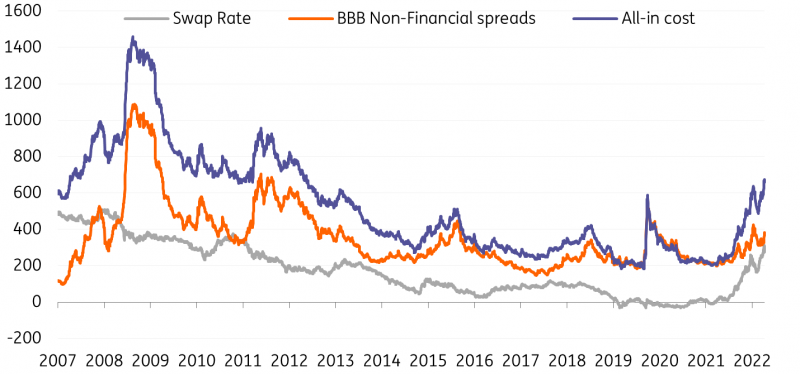
Source: ING, ICE, Refinitiv
Non-financial supply is now sitting at €201bn for 2022 thus far. This is significantly lower than the supply in previous years, for example, last year had already pencilled in €279bn by this time. We expect supply will be very low in the coming months, as we forecast no more than an additional €50bn to come this year. Of course, this does add strength to the technical picture as redemptions are €223bn this year, and when the €54bn of corporate sector purchase programme (CSPP) demand is included, there is a negative net supply. High yield supply has been very low this year, with just €14bn so far this year, compared to the average €50bn normally issued by this time.
EUR IG and HY Supply – very low supply this year
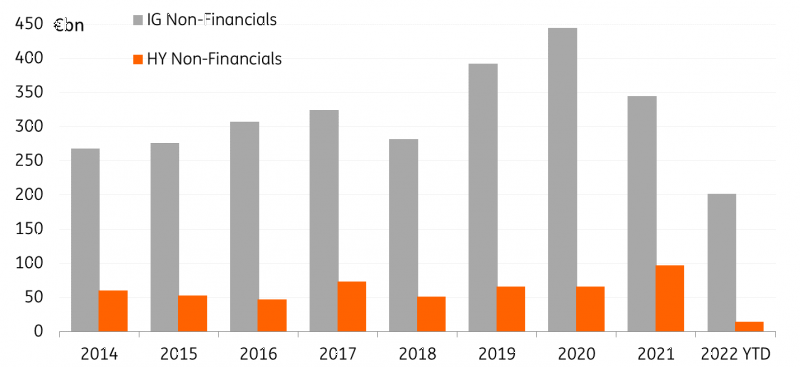
Source: ING, Dealogic
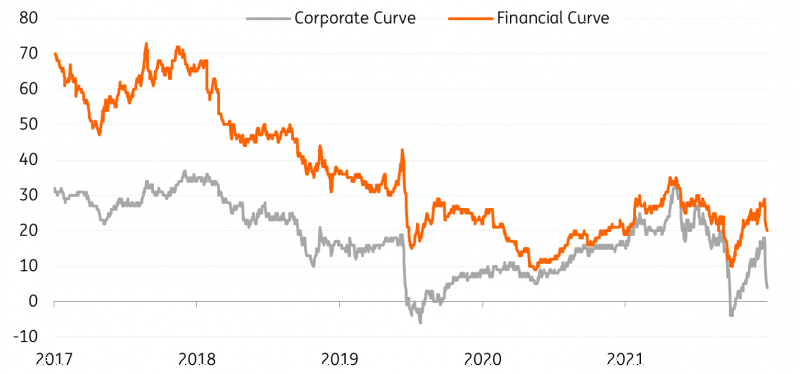
Curves remain very flat There was a sharp flattening of credit curves last week as the short-end saw large underperformance – with the 0-3yr bucket widening by 20-25bp and the 3-5yr bucket by 15-18bp. There was some slight re-steepening yesterday in this reversal, but this is very marginal as curves are not steepening as promptly as they flattened.
EUR credit curves looking very flat
Source: ING, ICE
BBB-rated debt has once again seen curves inverted. Real estate has yet again been beaten up, with 26bp widening on the week, with little retracement yesterday. Following that, autos, media, industrials, services and cgoodsapital good all underperformed. Corporate hybrids are also under pressure with 23bp widening. Although outperformed yesterday with a notable 7bp of tightening, we feel that up against equities and BB spreads, hybrids do offer more value.
Read the original analysis: How stressed are euro rates and credit markets?
Author

ING Global Economics Team
ING Economic and Financial Analysis
From Trump to trade, FX to Brexit, ING’s global economists have it covered. Go to ING.com/THINK to stay a step ahead.


