How high will the unemployment rate rise in April?


Leisure and hospitality jobs once again provide an accurate recession signal.
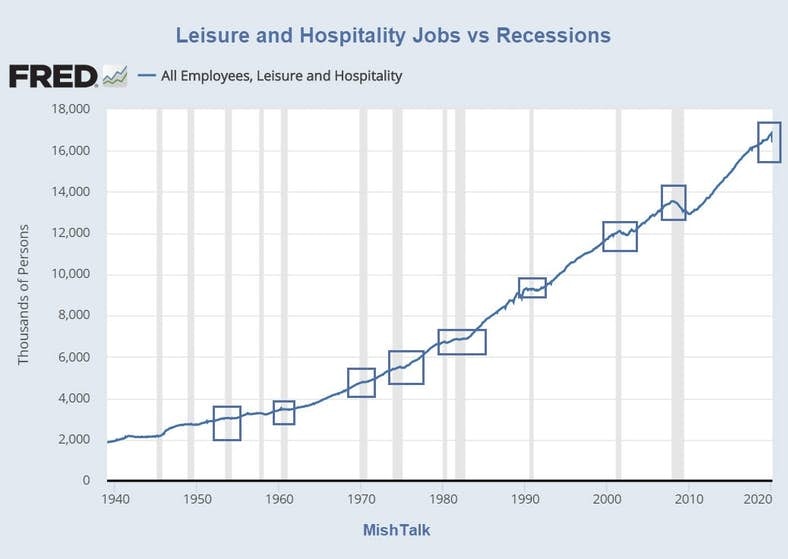
Leisure and Hospitality Jobs vs Recessions
Leisure and Hospitality Jobs will be the hardest hit in this recession once again so let's start there.
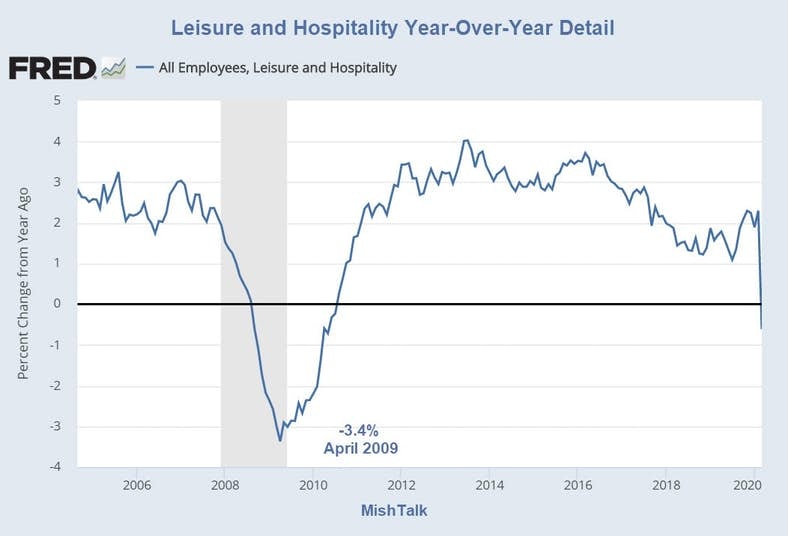
Leisure and Hospitality Percent Change From Year Ago Detail
In February, there were 16.8 million Leisure and Hospitality (L&H) workers.
If only half of them lose their jobs (and that is very optimistic), that's 8.4 million layoffs just in this category.
The previous worst case was -3.4% in April of 2009.
Food Services and Drinking Places
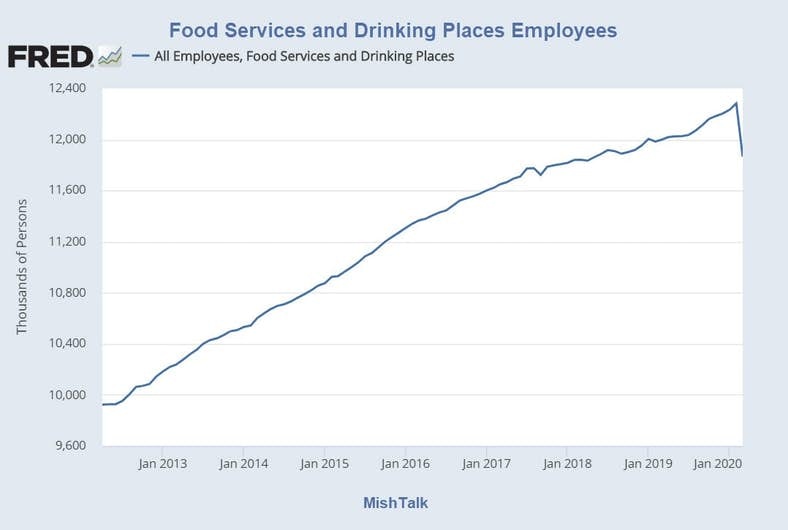
In February there were 12.3 million employed in the Food Services and Drinking Places category.
Food Services is a subset of L&H.
Assuming 80% layoffs, there will be close to 10 million losses in this subcategory alone.
Crunching the Numbers
Let's grab some numbers from my review of the March jobs report Unemployment Rate Jumps to 4.4% But Worst is Yet to Come.

If we make the assumption that the economy will only shed 10 million workers in L&H and none anywhere else, we can calculate the April unemployment rate as follows.
(7.14 million existing + 10 million new) / 162.91 million labor force = 10.5%.
That is a silly assumption given all that it ignores, yet, there are sub 10% unemployment forecasts.
Hard-Hit Employment Categories
L&H will be the hardest hit category but it will not be the only hard-hit category.
What about all the people working in retail stores and temporary help?
Risk Groups
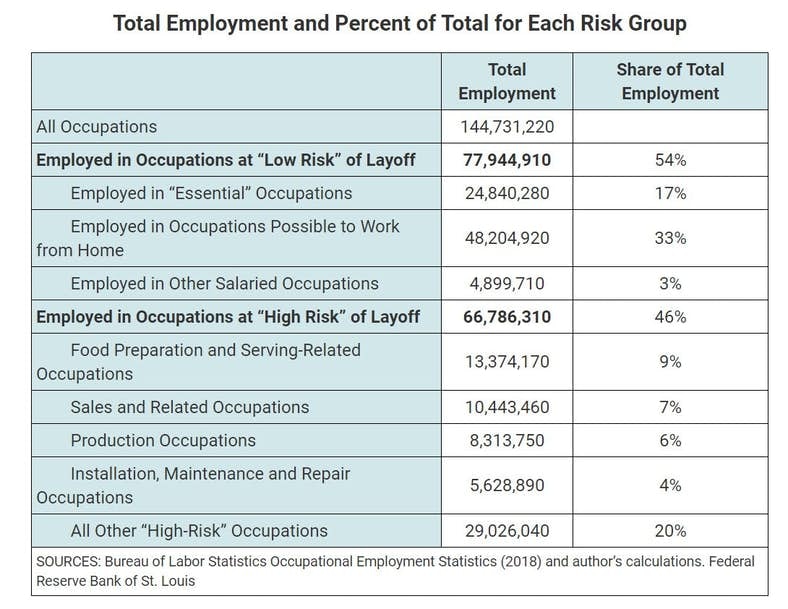
The above chart is from the St. Louis Fed Article COVID-19: Which Workers Face the Highest Unemployment Risk?
The author did not estimate job losses but he did provide a couple of IFs.
For the unemployment rate to reach 9%, an additional 9 million workers would have to become unemployed, the equivalent of 13% of workers in high-risk occupations.
Alternatively, if 50% of workers in high-risk occupations were to be laid off, the unemployment rate would reach 24%.
Nine percent seems wildly optimistic by my model.
Estimating Job Losses
- Food Services and Drinking Places: 9.5 million (80% of 11.9 million)
- Leisure and Hospitality: 2.3 million (50% of the rest of L&H excluding Food Service (16.4 - 11.9) * .5 )
- Retail Trade: 3.9 million (25% of 15.6 million)
- Temporary Help: 1 million (33% of 2.9 million)
- Professional and Business Services: 3.2 million (15% of 21.6 million jobs)
- Teachers: 1 million (25% of 4 million public school teachers. Union rules vary widely.)
There are 151 million All Employees.
Excluding my breakouts, there were another 151-16.4-15.6-2.9-21.6-4 = 94.5 million employed in March.
If 7.5% of them lose their job, that's another 7 million.
Total Job Losses in Millions = 9.5 +2.3 +3.9 +1 +3.2 + 1 + 7 = 27.9 million.
Let's crunch that.
Estimated Unemployment Rate
(7.14 million current + 27.9 million new) / 162.91 million labor force = 21.5%.
Another way to arrive at this number is to assume 11.8 million L&H workers and another X% from the rest of the 46% of high risk workers plus another Y% from the bigger safe worker pool.
What would X be using the St. Louis Fed table?
66.8 million minus 16.4 million L&H = 50.4 million remaining High Risk Employees. I have 11.8 million L&H jobs going away so I would need another 27.9 minus 11.8 or 18.1 million jobs elsewhere.
If they all came from that pool it would take roughy 36% of the rest of the high risk pool. But surely some would come from the safer areas. 3% of the 77.9million safe jobs would be 2.3 million workers.
Is that low? If not, to get to 21.5% unemployment we would need 15.8 million out of the high risk pool, about 31%.
There are many ways to top the 20% mark assuming my initial estimate of 11.8 million L&H jobs is in the ballpark.
Looking for a Range?
Try 16% to 28%. Yes, that's wide. It could take two month to reach.
Feel free to plug in your own assumptions from my starting point.
By monitoring the next three weekly unemployment reports, we can hone in on that number.
Regardless, a new record high unemployment rate is baked in the cake and that does not count those forced to part-time work.
Reference Period
The reference period week for determining the unemployment rates is the week that that contains the 12th of the month. That makes the next reference period April 12-18.
If you work as little as one hour in the reference period week, you are considered employed.
The better the unemployment rate looks in the May report (for April), the more likely hours will be reduced across the board somewhere else.
The U-6 unemployment rate which counts people working part-time who want a full time job can easily top 30%.
Heck, a straight up 30% is not out of the question if you consider dentists, dental assistants, ambulatory services, airlines, boeing, GM, and car-related manufacturing, etc, and I am low on retail and the alleged "safe" group.
How Fast a Recovery?
Eventually, the coronavirus depression will subside. But what will America look like when it does?
The huge fear now is How Do I Pay the Bills?
This is the second crisis in 12 years. These scars will last.
Note that Vehicle Sales Plunge by 5.5 Million Units, Most Since 1987.
With the stock market down and consumer savings wiped out, will car sales quickly recover?
The same question applies to eating out and airline travel. Simply put, a quick return to business as usual is not in the cards.
For a 20-point discussion of what to expect, please see Nothing is Working Now: What's Next for America?
No V-Shaped Recovery
Add it all up and you should quickly arrive at the correct viewpoint: The Covid-19 Recession Will Be Deeper Than the Great Financial Crisis.
Author

Mike “Mish” Shedlock's
Sitka Pacific Capital Management,Llc


