High Silver Prices Could Be On the Verge Of Collapse

Key Points:
-
Descending triangle pattern is nearing completion.
-
Strong EMA evidence for a breakout to the downside.
-
FOMC meeting is worth keeping in mind this week.
Silver has been enjoying a stint of relatively high prices amid the somewhat elevated uncertainty surrounding markets. However, the metal has begun to experience a decline over the past few weeks which could spell a breakout in the near future. In fact, if the daily S1 support level is broken this week, we could see a significant tumble instore for Silver prices.
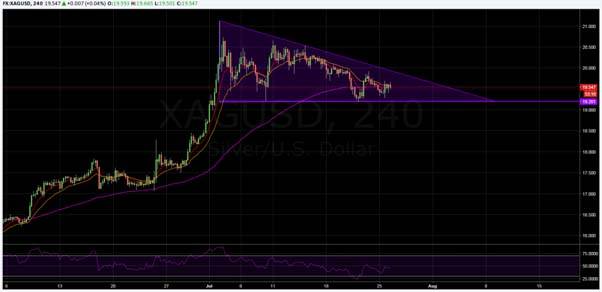
As shown on the H4 chart, the metal has been forming a descendingtriangle over the past number of sessions. At its current trajectory, the pattern should reach completion within the next few days or, at the latest, the end of next week. Completion of a descending triangle typically leads to a breakout but the direction of such a breakout can be difficult to predict. In this case however, there is a sizable body of evidence suggesting that a downside breakout is the most probable outcome.
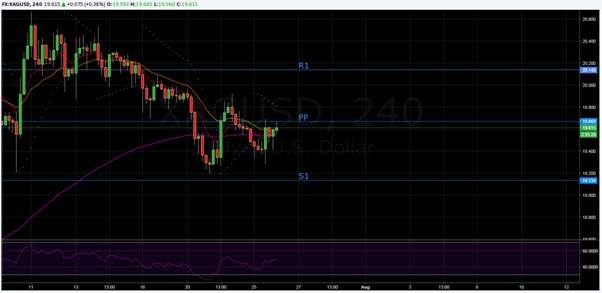
Demonstrated on the above chart, the EMA activity is on the cusp of becoming strongly bearish. Specifically, the 100 period EMA is manoeuvring to complete a bearish crossover with the already bearish 12 and 20 period EMA’s. If such a crossover does occur, selling pressure will begin to mount significantly and this could provide the requisite momentum to see the lower constraint of the triangle broken.
Furthermore, whilst there does remain some scope for bullishness over the next few sessions, pivot point and Fibonacci level analysis is suggesting that the 19.69 resistance should hold. This is largely a result of the PP level coinciding with the 38.2% Fibonacci retracement which should prove to be a difficult zone of resistance to breach. If the level does hold firm, this will tighten the triangle pattern and, ultimately, shorten the timeframe in which one would expect to see a breakout. Additionally, it would be relatively evident that said breakout had occurred once the S1 level has been broken at around the 19.13 mark.
One final indicator reading which suggests that Silver could be about to transition into a bearish phase is the Parabolic SAR. On not only the H4 chart but also the daily chart, Parabolic SAR readings are strongly bearish which will be limiting upside potential for the metal. However, if the 19.80 level is tested it could see the H4 reading reverse to bullish. If this occurred, it will likely mean that a breakout will eventuate somewhat later in the proceedings.
Ultimately, with the FOMC meeting occurring this week, there remains achance that a surprise rate change could upset any technical patterns. However, forecasts are presently in favour of the Federal Funds Rate remaining steady at the 0.50% mark. As a result of this, the technical breakout discussed above is relatively likely to remain undisrupted by the Federal Reserve in the coming days. This being said, stay abridged of the inevitable jawboning that will accompany the FOMC meeting as this could impact the metal heavily.
Author

Matthew Ashley
Blackwell Global Investments Limited
Matthew joined Blackwell Global in March 2016; he works as a currency analyst in the research department based in Auckland.


