Happy Halloween [Video]
![Happy Halloween [Video]](https://editorial.fxstreet.com/images/Markets/Bonds/Euribor/stock-analysis-9855424.jpg)
US Dollar: Dec '22 USD is Up at 110.950.
Energies: Dec '22 Crude is Down at 86.66.
Financials: The Dec '22 30 Year note is Down 20 ticks and trading at 120.20.
Indices: The Dec '22 S&P 500 emini ES contract is 73 ticks Lower and trading at 3893.00.
Gold: The Dec'22 Gold contract is trading Down at 1641.00. Gold is 38 ticks Lower than its close.
Initial conclusion
This is not a correlated market. The dollar is Up, and Crude is Down which is normal, but the 30-year Bond is trading Lower. The Financials should always correlate with the US dollar such that if the dollar is lower, then the bonds should follow and vice-versa. The S&P is Lower, and Crude is trading Lower which is not correlated. Gold is trading Lower which is correlated with the US dollar trading Up. I tend to believe that Gold has an inverse relationship with the US Dollar as when the US Dollar is down, Gold tends to rise in value and vice-versa. Think of it as a seesaw, when one is up the other should be down. I point this out to you to make you aware that when we don't have a correlated market, it means something is wrong. As traders you need to be aware of this and proceed with your eyes wide open. Currently Asia is trading mainly Higher with the exception of the Shanghai and Hang Seng exchanges. Europe is trading Mixed at this time with half the exchanges Higher and the other half Lower.
Possible challenges to traders today
-
Chicago PMI is out at 9:45 AM EST. This is Major.
-
Loan Officer Survey is tentative and Major.
-
Lack of Major economic news.
Treasuries
Traders, please note that we've changed the Bond instrument from the 30 year (ZB) to the 10 year (ZN). They work exactly the same.
We've elected to switch gears a bit and show correlation between the 10-year bond (ZN) and the S&P futures contract. The S&P contract is the Standard and Poor's, and the purpose is to show reverse correlation between the two instruments. Remember it's likened to a seesaw, when up goes up the other should go down and vice versa.
On Friday the ZN made its move at around 10 AM EST. The ZN hit a High at around that time and the S&P moved Higher shortly thereafter. If you look at the charts below ZN gave a signal at around 10 AM and the S&P gave a signal at around the same time. Look at the charts below and you'll see a pattern for both assets. ZN hit a High at around 10 AM and the S&P moved Higher shortly thereafter. These charts represent the newest version of MultiCharts and I've changed the timeframe to a 15-minute chart to display better. This represented a Short opportunity on the 10-year note, as a trader you could have netted about 20 plus ticks per contract on this trade. Each tick is worth $15.625. Please note: the front month for the ZN is now Dec '22. The S&P contract is also Dec' 22. I've changed the format to Renko Bars such that it may be more apparent and visible.
Charts courtesy of MultiCharts built on an AMP platform
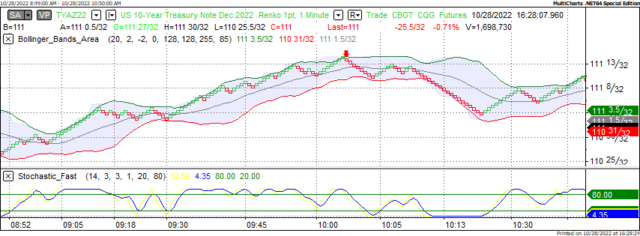
ZN - Dec 2022 - 10/28/22
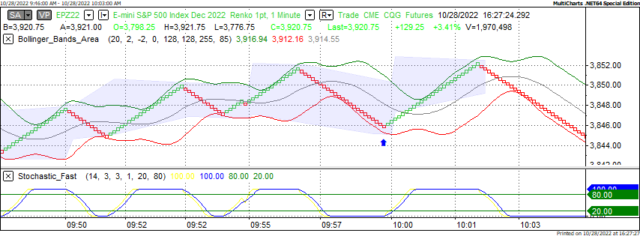
S&P - Dec 2022 - 10/28/22
Bias
On Friday we gave the markets a Neutral or Mixed bias as we saw no evidence of Market Correlation at all. The Dow traded Higher by 829 points and the other indices traded Higher as well. Today we aren't dealing with a correlated market and will maintain a Neutral bias.
Could this change? Of Course. Remember anything can happen in a volatile market.
Commentary
So, when we viewed the market early Friday morning, our first reaction was Mixed market as we saw no real evidence of correlation Friday morning. The Dow traded Higher, and the other indices traded Higher as well. The Dow zoomed forward gaining 829 points for the session. Today we don't have much in the way of economic news so the markets will rely on it's own devices today. We do have Chicago PMI out at 9:45 AM EST, but that's about it in terms of economic news. Given that today is Halloween perhaps the markets are telling us something? As in all things time will tell...
Author

Nick Mastrandrea
Market Tea Leaves
Nick Mastrandrea over 20 years experience in trading and formerly held a NASD Series 7. He currently holds a NJ Life, Health and Variable Authority. Nick is a published writer and his work has appeared in Futures Magazine, TraderPlanet and others.


