Technical analysis: Will the HK50 quotes continue to grow?
Hang Seng Index technical analysis summary
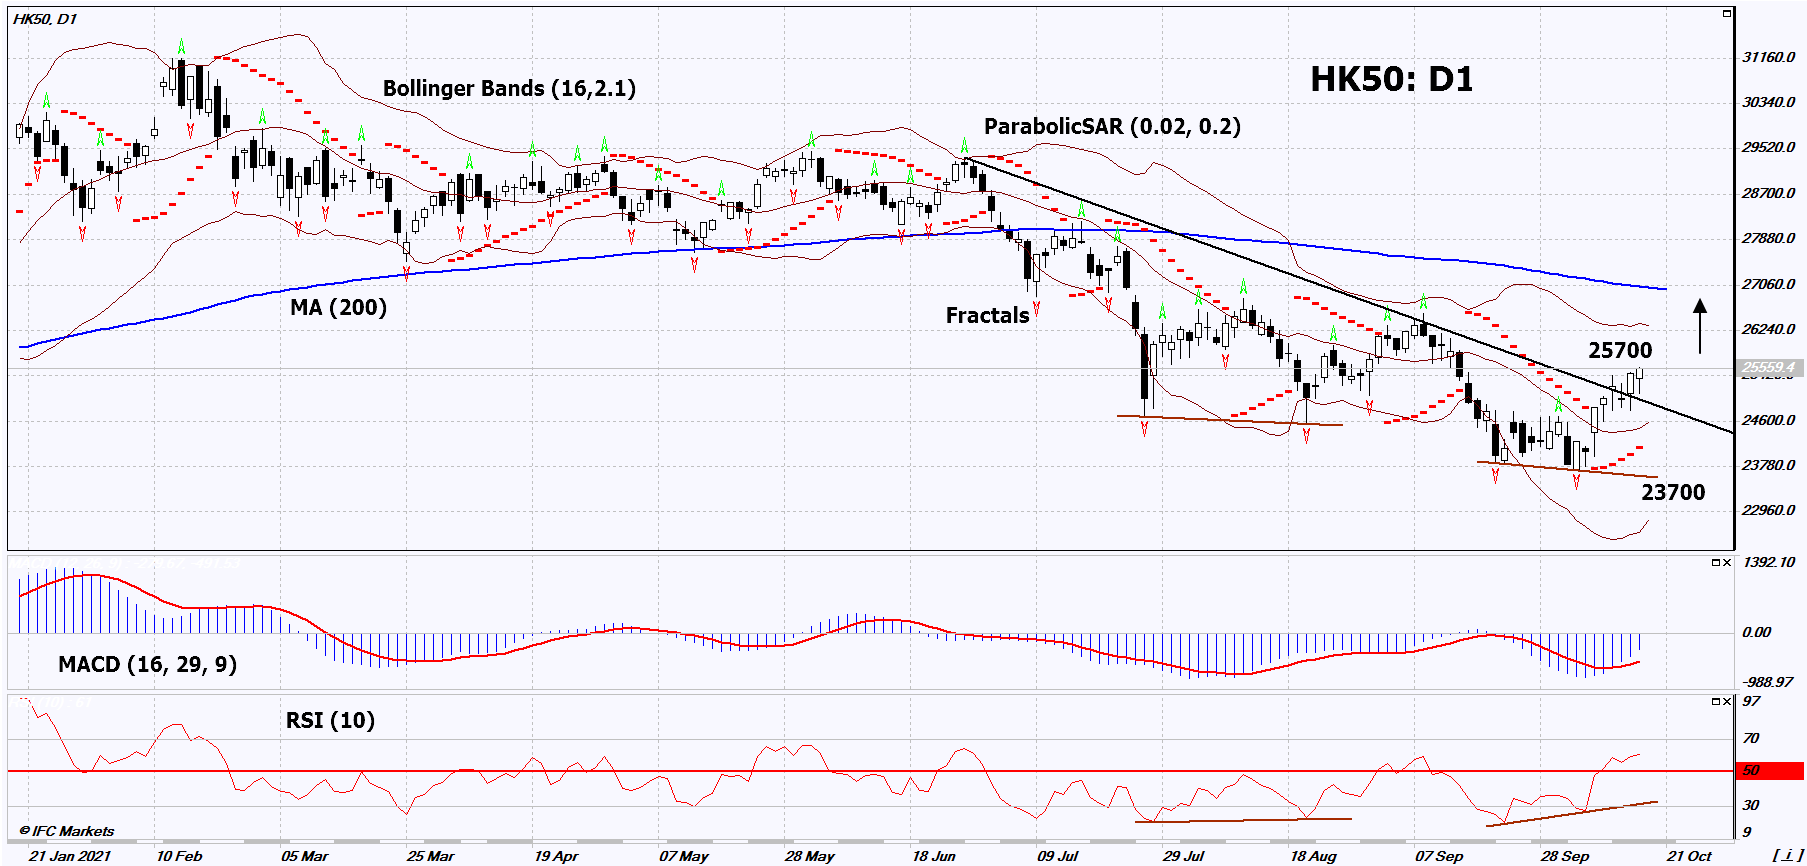
Buy Stop: Above 25700.
Stop Loss: Below 23700.
| Indicator | Signal |
| RSI | Buy |
| MACD | Buy |
| MA(200) | Neutral |
| Fractals | Buy |
| Parabolic SAR | Buy |
| Bollinger Bands | Neutral |
Hang Seng Index chart analysis
Hang Seng Index technical analysis
On the daily timeframe, HK50: D1 broke up the downtrend resistance line. A number of technical analysis indicators have formed signals for further growth. We do not rule out a bullish movement if HK50: D1 rises above the last high: 25700. This level can be used as an entry point. The initial risk limitation is possible below the last lower fractal, the Parabolic signal, and the minimum for 12 months: 23700. After opening the pending order, move the stop following the Bollinger and Parabolic signals to the next fractal minimum. Thus, we change the potential profit/loss ratio in our favor. The most cautious traders, after making a deal, can go to the four-hour chart and set a stop-loss, moving it in the direction of movement. If the price overcomes the stop level (23700) without activating the order (25700), it is recommended to delete the order: there are internal changes in the market that were not taken into account.
Fundamental analysis of indices - Hang Seng Index
The Central Bank of China announced that it controls the risks associated with the activities of the construction company China Evergrande Group. Will the HK50 quotes continue to grow?
It should be emphasized that China Evergrande Group shares are not listed in the Hang Seng General Index (HSI), but they are present in its sectors such as the Hang Seng Composite Index (HSCI) and a few others. The company is ranked 227th in the world according to the Forbes rating, and in China it is 31st. People's Bank of China (Chinese Central Bank) said that the financial difficulties of China Evergrande Group are a special case. The risks of spreading them to other companies and banks are manageable. Thanks to this, China Evergrande Group ADR in the US rose 4.3% on Monday. The Hang Seng Index climbed 0.3% despite slowing Chinese GDP growth in the third quarter of 2021 to + 4.9% on an annualized basis from 7.9% in the second quarter. This is worse than expected (+ 5.2%). Note that the Hang Seng has declined by 6.7% since the beginning of this year and is far behind other global indices. S&P 500 growth since the beginning of the year has grown by 19.3%, DAX - by 12.8%, FTSE 100 - by 11.5%, Nikkei 225 - by 5.8%.
Want to get more free analytics? Open Demo Account now to get daily news and analytical materials.
Want to get more free analytics? Open Demo Account now to get daily news and analytical materials.
Author

Dmitry Lukashov
IFC Markets
Dimtry Lukashov is the senior analyst of IFC Markets. He started his professional career in the financial market as a trader interested in stocks and obligations.


