Gold's new breakout is very bullish: Here's why

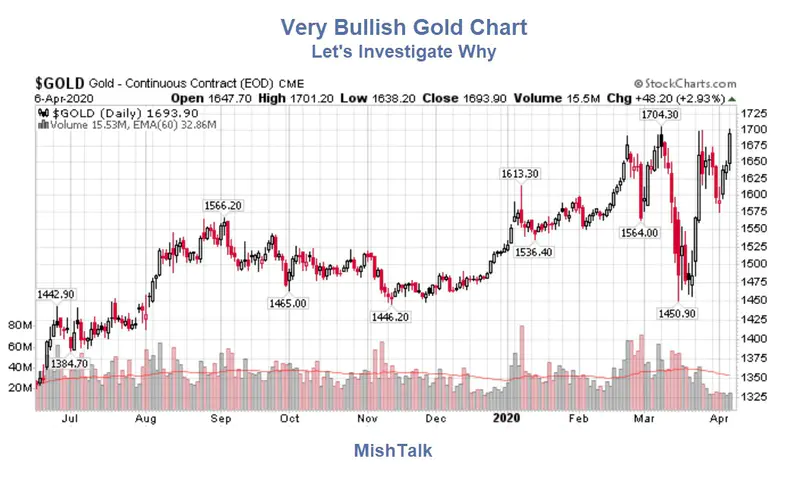
Gold hit a new high for the move to $1714 and a new closing high of $1707. Additional charts explain the significance.
Next Major Resistance
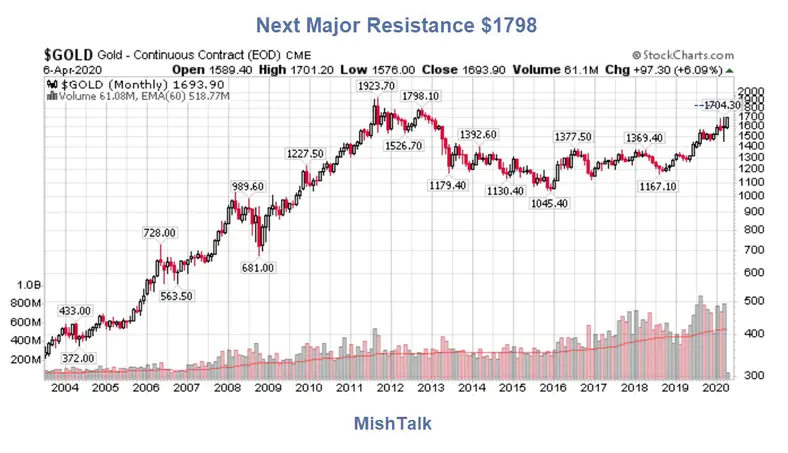
Gold's next major resistance points are $1798 then the all time high (in US dollar terms) of $1694.
It's how we got here that's hugely bullish.
Gold vs Commitment of Traders Report
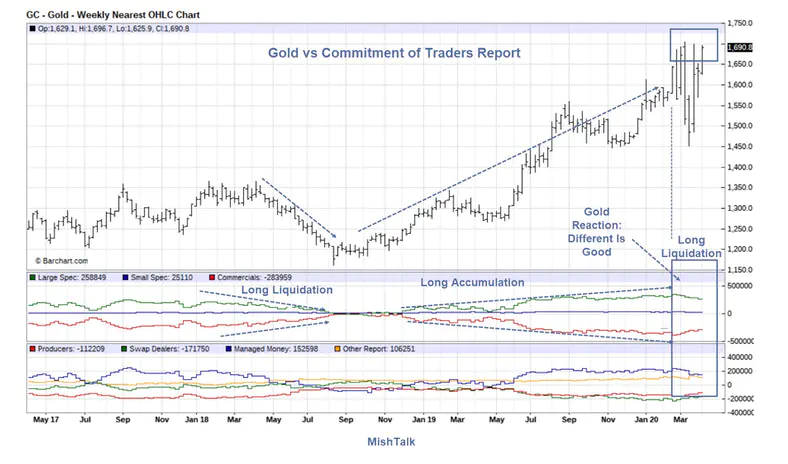
The above chart is from Barchart. They have excellent interactive COT charts.
Understanding Futures
In the futures world there is a short for every long.
The first horizontal box has Large Specs, Small Specs, and Commercials. The second box distinguishes producers from the swap dealers (i.e. market makers). It's Old vs New COT reporting.
We frequently hear things like the commercials are record short or record long.
Such comments put the cart in front of the horse. The commercials are not the driving force. Speculators are (Managed Money and Other) (Large Spec and Small Specs) depending on which set of numbers you wish to use.
The producers mine gold and sell it via futures.
The Swap Dealers are commercial market makers who take the other side of the trade. They do so because as Market Makers they have to. It's their business to make a trade.
The swap dealers are hedged. They do not much care if prices rise of fall. If that was not the case, they would be blown out of the water on big, sustained rallies. That does not imply honesty as the dealers have been caught manipulating. Rather, they manipulate if their hedges get out of balance or they see a chance to profit. The latter could be in either direction, up or down in the price of gold.
Regardless, the dealers are not going to get blown out of the water if the price rises high enough as is often claimed.
Commercials Don't Cover Shorts
Another thing we hear is "commercials covered" their shorts or the commercials are the "smart money"
That is nonsense as well.
The producers don't buy gold and the swap dealers are hedged (long gold and short equivalent futures). There is nothing "smart" about being forced to take the other side of a trade.
This subject comes up all the time.
For example, on December 27, Tom McClellan said "Gold COT Data Call for More of a Drop"
Gold was at the $1500 level.
Investigating Alleged Smart Money Positions in Gold
I responded with Investigating Alleged Smart Money Positions in Gold which led to a nasty exchange over me using his chart so I produced my own and linked to him.
On March 12, McClellan said Gold Moving Lower Despite Covid-19.
McClellan said "Gold prices should start trending down now, and for the next 5 years, according to this week’s chart."
I am reluctant to quote more over risk of being accused of copyright infringement once again. So, please read the article yourself if you think I may be out of context.
Long Accumulation and Liquidation
Instead of putting the cart before the horse regarding smart money, look at things this way.
Hedge funds and small traders accumulate gold. As they do, prices tend to rise. That's best viewed as "long accumulation".
When gold peaks (sentiment changes and hedge funds and mo-mo investors are not willing to add more contracts) the setup reverses.
Prices tend to decline in "long liquidation".
Gold vs Commitment of Traders Report Detail
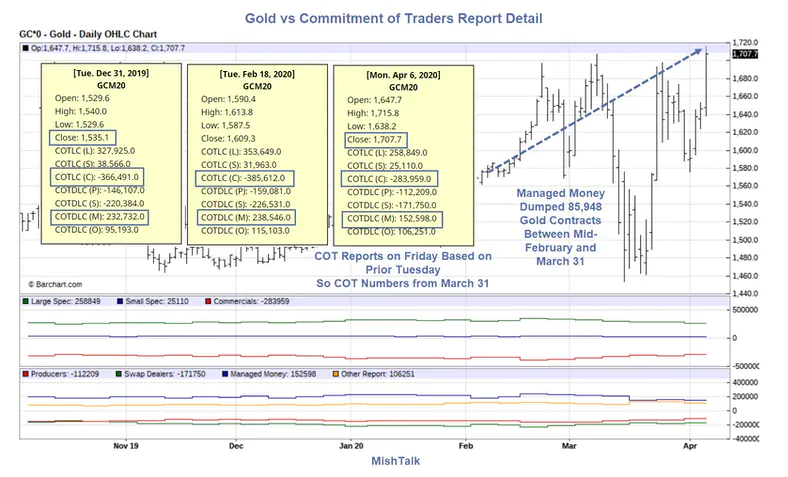
Managed Money
Note that the Managed Money crowd (hedge funds etc.) were long 232,732 contracts at the end of December with the price of gold at roughly $1500.
As of last Tuesday, Managed Money was long 152,598 contracts. That is a long liquidation of 80,139 gold contracts.
Somehow the alleged "smart money" was on the wrong side of the move as the commercials went from 366,491 short contracts to 283,959 short contracts.
To weed out the producers, focus on the Swap Dealers. They went from 220,340 short contracts to 171,750 short contracts.
Q: Smart Money?
A: No
Curiously, Managed Money is both smart and dumb depending on which way the price of gold is moving.
Gold vs Faith in Central Banks
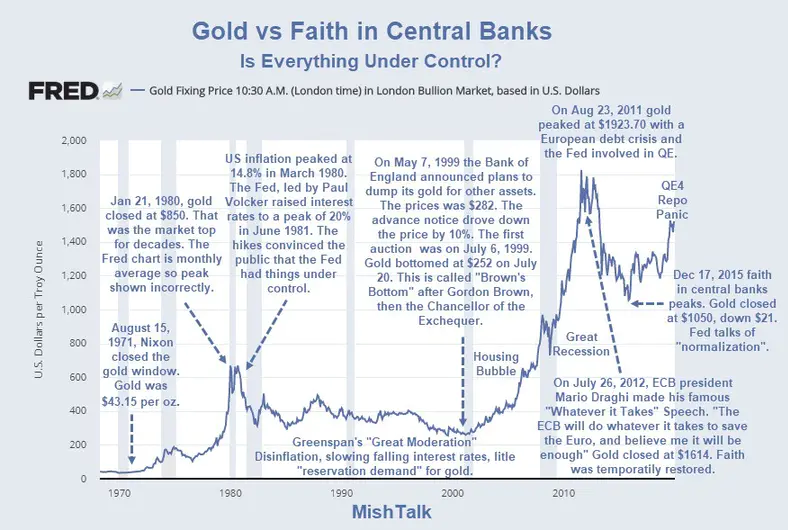
Why Am I Especially Bullish?
The answer is the price of gold blasted to new highs while long liquidation was happening.
This is not a normal occurrence.
If you believe as I do that the price of gold is reflective of faith in central banks, there is every reason to be bullish rather than pay heed to alleged 5-year cycles.
COT action is icing on the bullish case.
Gold as an Enforcement Mechanism
twitter.com
Physical Gold vs Paper Gold
The other meme of the day is an alleged huge price difference between physical gold and paper gold, with futures representing one form of paper gold.
In reality, there is no shortage of gold, but there are shortages of some forms of gold, primarily due to delivery issues.
For discussion, please see No WSJ, Gold is Not the New Unobtanium: Where to Buy?
Author

Mike “Mish” Shedlock's
Sitka Pacific Capital Management,Llc


