Gold’s current stance

Everyone’s talking about what happened in the U.S., as rioters invaded Capitol Hill and took over the place disrupting a session where Joe Biden’s victory in the Presidential Election was to be confirmed by Congress. The event made a big splash in the markets and especially with Gold.
The precious metal was already having a very rough day. It began with the Asian session when it tried to move higher, however encountered heavy resistance at the $1,960 level. It took that rejection hard, as the instrument fell from the mentioned resistance level, all the way towards the $1,900 support. Luckily, there were enough buyers at that support in order to prevent a further drop.
After reaching the mentioned support, the yellow metal was able to bounce back higher towards the $1,920, where it currently consolidates. There are several factors that can be attributed to the fall as well as the rise in the yellow metal, chief among them would be the civil unrest that is currently happening in the United States. This had put a big damper on the dollar which languished around its lowest levels in almost three years.
Meanwhile, a Democrat sweep in Georgia’s Senate runoff election raised expectations for more US stimulus measures. Expectations of larger government borrowing pushed the benchmark 10-year US Treasury yield beyond the 1.0% mark, reaching the highest level since March and keping a lid on any strong gains for the non-yielding yellow metal.
Furthermore, U.S. Private payrolls in December contracted for the first time since March, according to ADP. The decrease of 123,000 provided a sign that the U.S. economy had cooled considerably heading into the end of 2020. Expectations had been for growth of 60,000. Companies laid off a net 19.4 million workers in April and have recovered 9.9 million since, according to ADP.
Technically Speaking
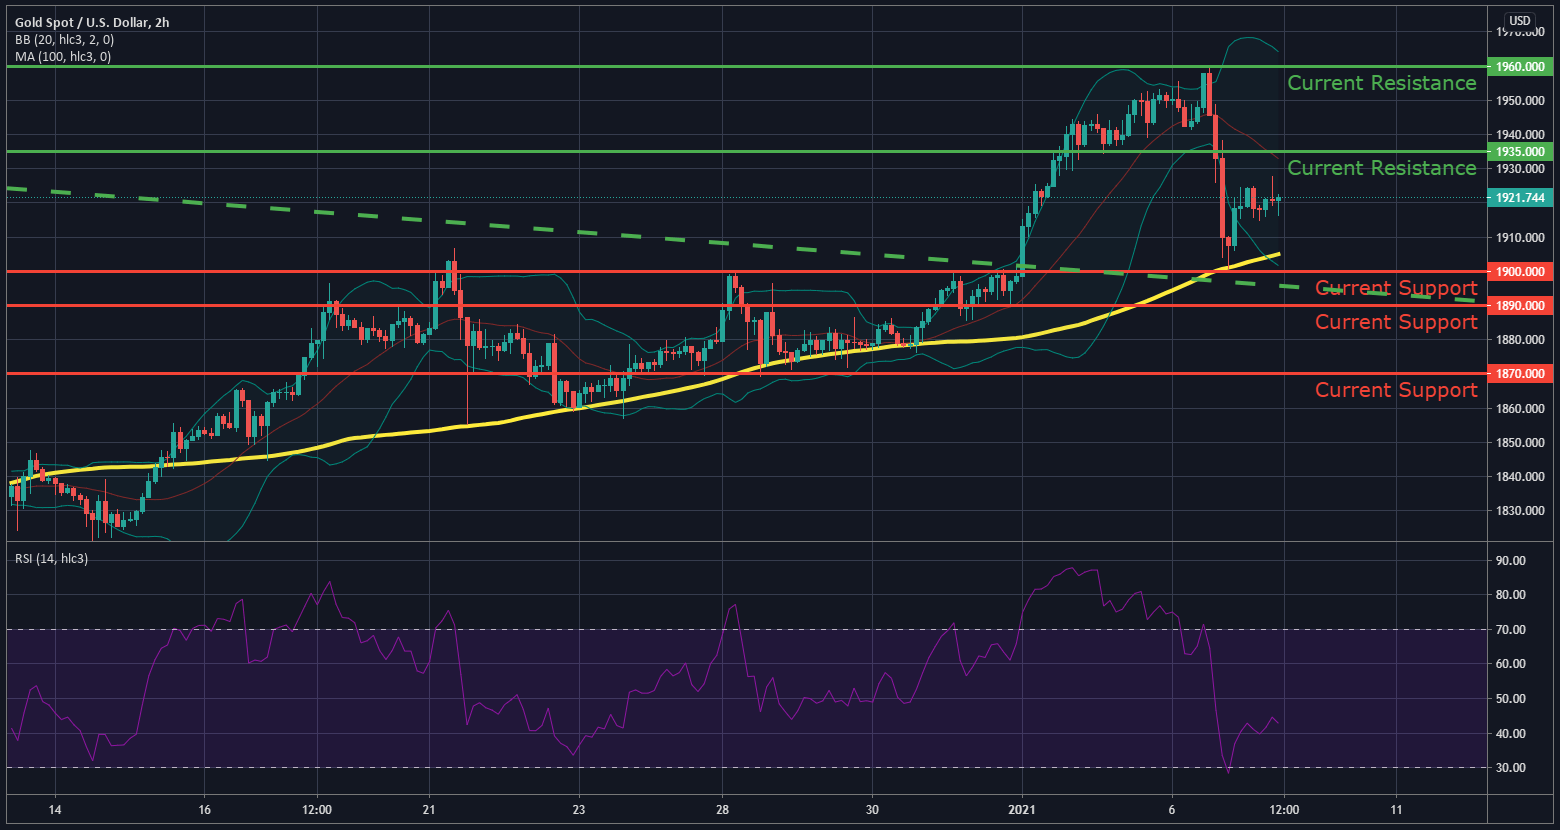
Looking into the technical aspect for XAU, we can notice that the $1,893 - $1,900 is the zone where the bounces should happen. It just so happens to be the descending trendline drawn from the August high. This gives the idea that XAU is currently consolidating it’s gains/ losses. However, the only way that a continuation to the upside happens is if the price manages to break above the $1934.85 and establish a daily close above that level.
On the flip side, the $1,885 is where Bears are looking at. In case the mentioned level is lost, we should see a move down to $1,869 and Gold would establish a bearish trend. The drop that can be seen on the graph, isn’t all that alarming. You see, if you’d notice the RSI (Relative Strength Index) and compare it to the price action between January 4th and January 6th, a massive divergence can be observed. The Price action was clearly going higher, while the RSI was clearly going lower, this divergence, alongside other catalysts, were the reason for Gold to have such a massive pullback.
However, now the pull has taken place, and the RSI and price action are in sync with each other once again, we can expect, at this point in time, that the safe haven flights still go into the precious metal and buying the dips is the option.
Author

Alexander Douedari
Independent Analyst
Alexander Douedari is an Award Winning Hedge Fund Manager and Selfmade 7-Figure Trader. Now Mentor for Students all around the world.