Goldman says retail has shifted from "buy the dip" to "trade the mania"
From "buy the dip" to "trade the mania"
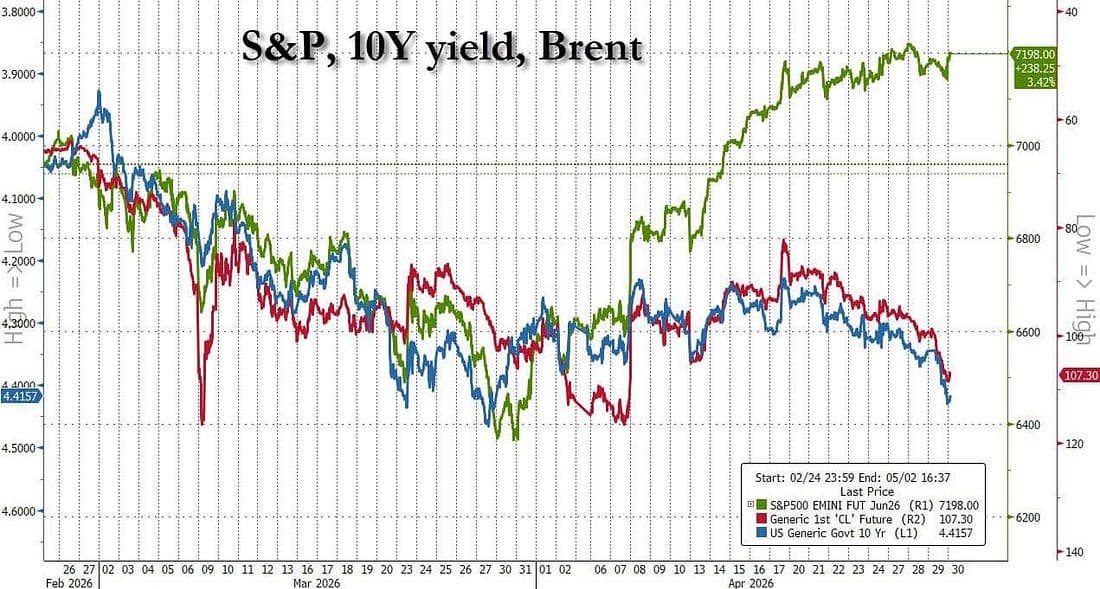
Equity futures are sprinting into uncharted highs just as Brent claws out fresh post-war peaks, yet the two aren’t even in the same conversation. The tape feels untethered, floating on this almost blind faith that AI spending will keep flooding the system despite the reality that those budgets can be pulled back in an instant, like someone dimming the lights mid-party.
It may not feel like it on the surface, but under the hood, the tape is getting trickier to navigate. The easy tailwinds that powered the climb are thinning out—systematic flows are no longer pressing the bid the way they were, month-end brings the usual pension rebalancing drag, and that seasonal pulse of retail buying tied to tax refunds is starting to fade.
Against that backdrop, Goldman’s flow desk is flagging a more subtle shift in behaviour. Retail isn’t just leaning into weakness anymore—it’s leaning into the story itself, migrating from the old “buy the dip” reflex to something far more momentum-chasing, a kind of “trade the mania” mindset where narrative outruns price discipline.
The problem, as always, is that manias have a shelf life. The same fuel that lifts the market can just as quickly evaporate, and the sense from Goldman’s desk is that we’re nearing a point where some of that excess needs to be burned off. Not a structural break, but a pressure release—shaving down the froth that’s built up on the run to fresh highs.
Into May, the picture doesn’t flip bearish, just more conditional. Corporate buybacks should still provide a steady underlying bid, and certain systematic players remain in the mix, but the environment is no longer one-directional. It’s more fluid, more reactive—one where positioning can turn faster than the narrative driving it.
That said, there’s still a seasonal tailwind worth respecting. The Nasdaq has a habit of finding its footing in May, especially when the market is anchored to long-duration growth themes, supported by IPO momentum and the aftershocks of earnings season. In other words, the stage is still set, but the script is getting less predictable.
Before getting into the weeds, here’s how I’d frame what Goldman’s flow desk is actually doing, stripped of the options jargon and put back into trader language.
1) Hedge: SPY May 29 700–660 put spread (~5.55 premium)
This is just a cheap seat at the downside table. You’re not calling for a crash—you’re acknowledging the tape has run hot and you want some protection if it finally exhales.
You’re paying a relatively small premium for a defined payout if the S&P rolls over into month-end. It’s not a hero trade, it’s discipline. The kind of structure you put on when you’ve made money on the way up and don’t feel like giving it back because the last buyer finally runs out of oxygen.
In plain terms: I’m still long, but I’m no longer naked.
2) Geopolitical kicker: small caps down / oil up structure (RTY vs crude)
This is where it gets more interesting. This is not a base case—this is a stress expression.
If things escalate, real escalation, not headline noise,you get the classic split:
- Small caps get hit (growth, domestic risk, liquidity sensitive)
- Oil rips (supply shock, Hormuz premium, all the stuff we’ve been talking about)
So you’re effectively long dislocation. Long the idea that if geopolitics bites, it won’t be subtle—it’ll show up hard in energy and bleed through risk assets.
In plain terms: If the world turns messy, I want to get paid from both ends of it.
3) Nasdaq outperform S&P (NDX > SPX into July)
This one’s almost muscle memory at this point. When the market trades on narrative—and right now it’s all AI, capex, secular growth—the Nasdaq keeps stealing the ball.
It’s not about whether the market goes up or down. It’s about who leads if it does anything at all. And history says in these environments, the heavy lifting stays in tech.
IPO flow, earnings follow-through, AI spend—whatever you want to call it—the bid tends to concentrate, not broaden.
In plain terms: If the party keeps going, it’s still happening in the same room.
Net-net:
This isn’t a clean directional view. It’s a desk that knows the tape is extended, knows flows are softening, and is starting to position for a more fragile phase—without stepping out of the trade entirely.
- Keep upside exposure (via tech leadership)
- Protect the downside (via cheap hedges)
- Own a tail if geopolitics breaks something
It’s not bearish. But it’s no longer carefree either.
1. CTAs: out for now
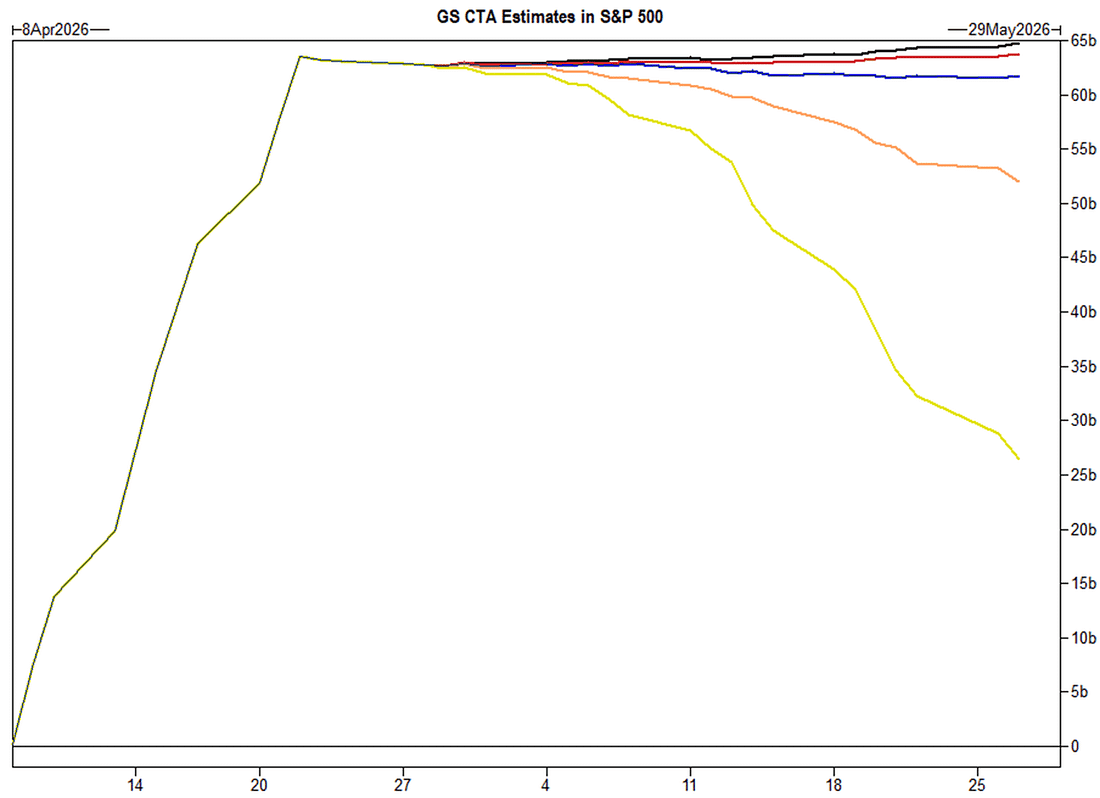
CTA buying has been the quiet engine under this rally—the kind of mechanical demand that doesn’t ask questions, just lifts offers. For a few weeks, it gave the tape a steady bid, the sort of flow that makes chasing feel safe because there’s always someone underneath you taking the other side.
And it wasn’t small. The one-month shift in positioning across the big systematic players ranks as the second-largest re-levering move we’ve seen since 2016. In other words, this wasn’t a gentle rotation—it was a full throttle re-engagement.
Roughly $80bn has flowed into US equities over the past month alone, with CTAs now sitting on about $44bn in long exposure. That’s real fuel. The kind that can turn a grind into a melt-up.
But here’s the catch, and it matters. That bid is now largely in the market. The same flows that gave you the green light to chase don’t keep accelerating forever. Once they’re loaded, they stop being incremental support and start becoming positioning that needs to be maintained.
And in this tape, maintenance is everything.
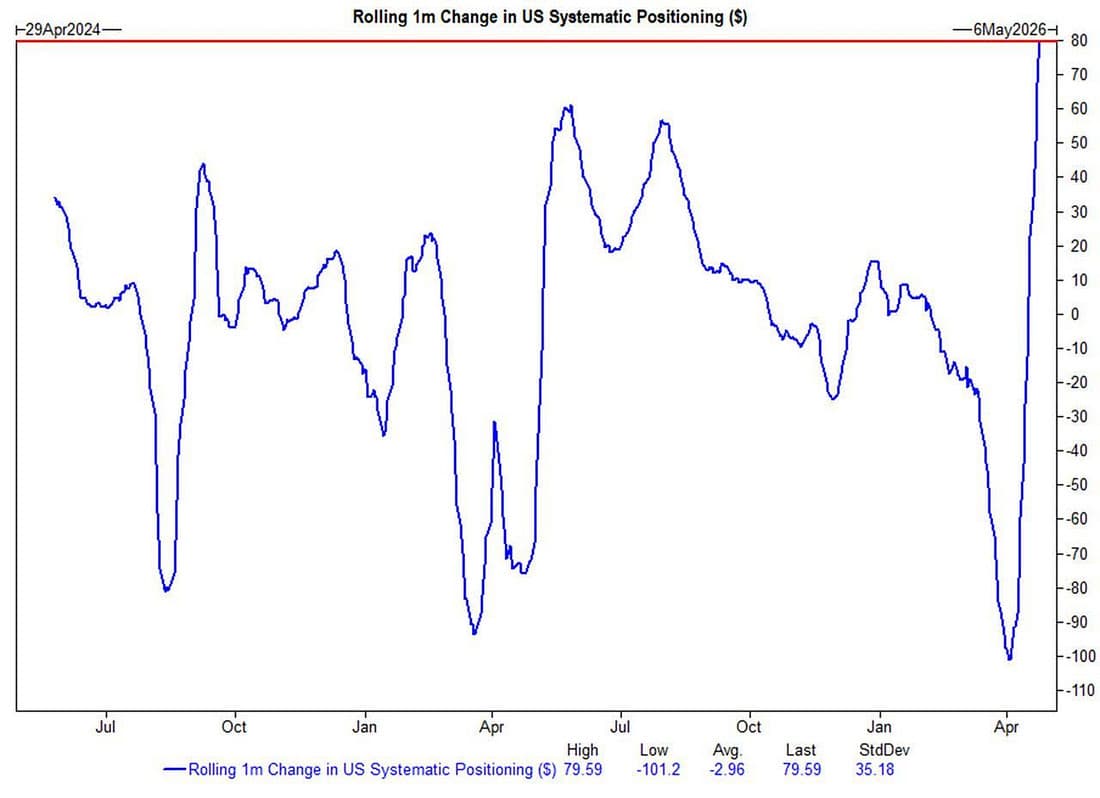
That mechanical bid that’s been carrying the tape? It’s no longer adding fuel—it’s starting to flicker.
CTA demand has rolled over and, at the margin, they’ve flipped into small sellers. The shift isn’t dramatic yet, but it matters because these flows are price-triggered rather than opinion-driven. They don’t wait around to be convinced—they react.
Right now, the S&P is still sitting comfortably above those trigger lines—about 3.75% above the short-term level and roughly 4.83% above the medium-term. That cushion has been the market’s shock absorber.
But if that buffer starts to erode, the dynamic flips quickly. Breach those thresholds, and you’re no longer talking about passive support, you’re looking at forced supply. Goldman estimates that could mean up to ~$50bn of equities hitting the market as CTAs flatten out.
And that’s the part the tape tends to underestimate. These flows don’t trickle, they cascade. What was once a steady bid becomes a source of pressure, and in a market already leaning long, that transition can feel a lot sharper than the move that got us here.
Here’s how I’d read Goldman’s CTA grid,this is the stuff I actually trade around, separate from anything longer-term.
The tone has clearly shifted.
On a 1-week view:
- Flat tape – sellers ~$7.7B
Even if we chop sideways, there’s a slow bleed. That tells you the easy bid is gone. - Up tape – still sellers (~$2.3B)
That’s the tell. We’re no longer in that phase where strength pulls in fresh CTA buying. Now it’s more supply into rallies. - Down tape – sellers pick up (~$17.5B)
If we slip, they lean on it. Not aggressive yet, but enough to matter.
So near-term, you’re not trading with a tailwind anymore. At best it’s neutral, and it can turn quickly if price starts to give.
On a 1-month view:
- Flat tape – sellers ~$20B
If nothing happens, they lighten up. No passive support sitting there. - Up tape – buyers ~$10B
Yes, they’ll re-engage if we keep grinding higher, but it’s not the same size as what we just saw on the way up. - Down tape – sellers ~$149B (with ~$50B out of US)
This is the one that matters. If we break those trigger levels, it’s not a trickle, it’s a proper unwind.
How I see it:
A few weeks ago, CTAs were the bid you could lean on them. That’s what made chasing work.
Now that the bid is largely spent.
You can still go higher, but it’s not being pushed the same way. And if we roll, those same players flip and start feeding the downside.
So the setup now is pretty simple:
- Upside can grind.
- The downside can accelerate.
And in this tape, that shift in character is everything.
2. Risk Parity
Is the party over? Not really, but the tone’s changed.
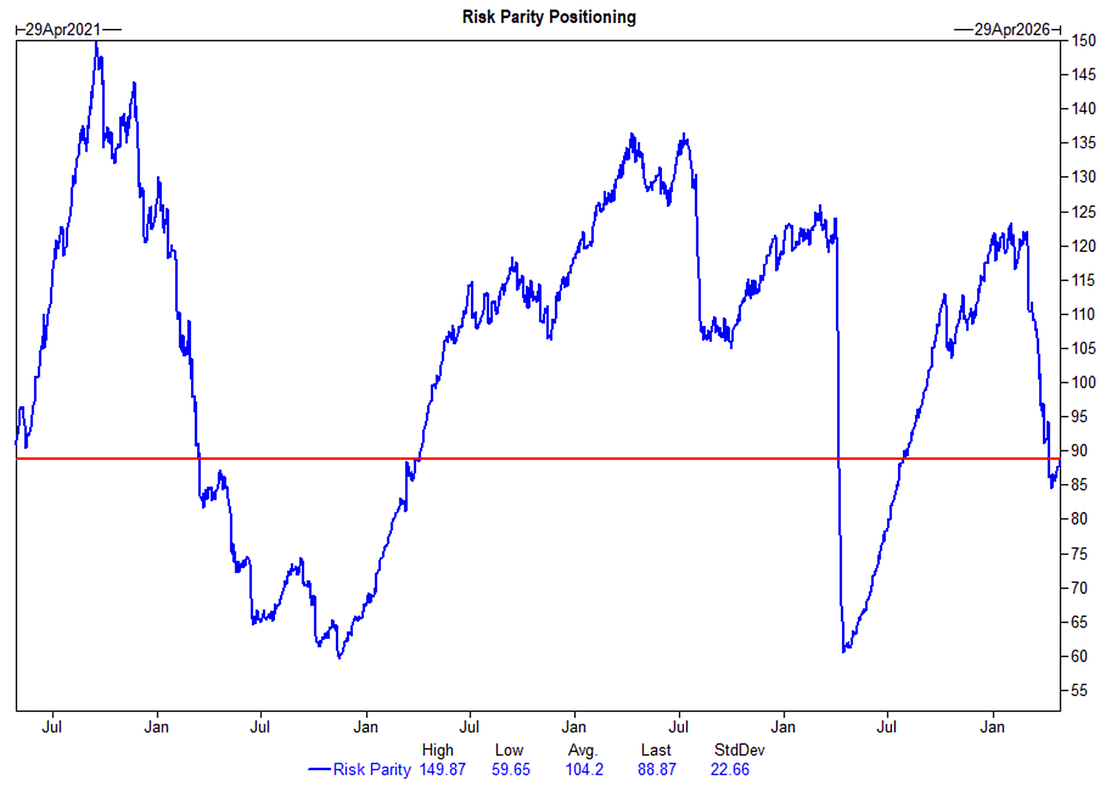
If CTAs were the ones kicking the door open and pushing the rally, risk parity is the slower money that shows up later and only leans in once things settle.
And that’s the key here, vol has come back down. That opens the door for them. Lower vol means they can take on more exposure, particularly in equities.
Positioning backs that up. They’re still light—bottom third of the range, whether you look back 1 year or 5. So there’s room to add if conditions hold.
But this isn’t the same kind of flow we’ve been trading around.
It doesn’t chase. It doesn’t react to every move. It builds gradually, and only if the environment stays stable. If things get choppy again, it steps back just as quietly.
So where does that leave us?
CTA fuel has largely run its course
- The market feels a bit more fragile at the edges
- But this slower money hasn’t really come in yet
- So no, it’s not over. It’s just a different phase.
The fast money’s had its run. Now you’re watching to see if the steadier bid shows up… or if the market starts to lose people before it does..
3. Volatility
This is one of those shifts you don’t see at first glance, but it changes how the tape trades.
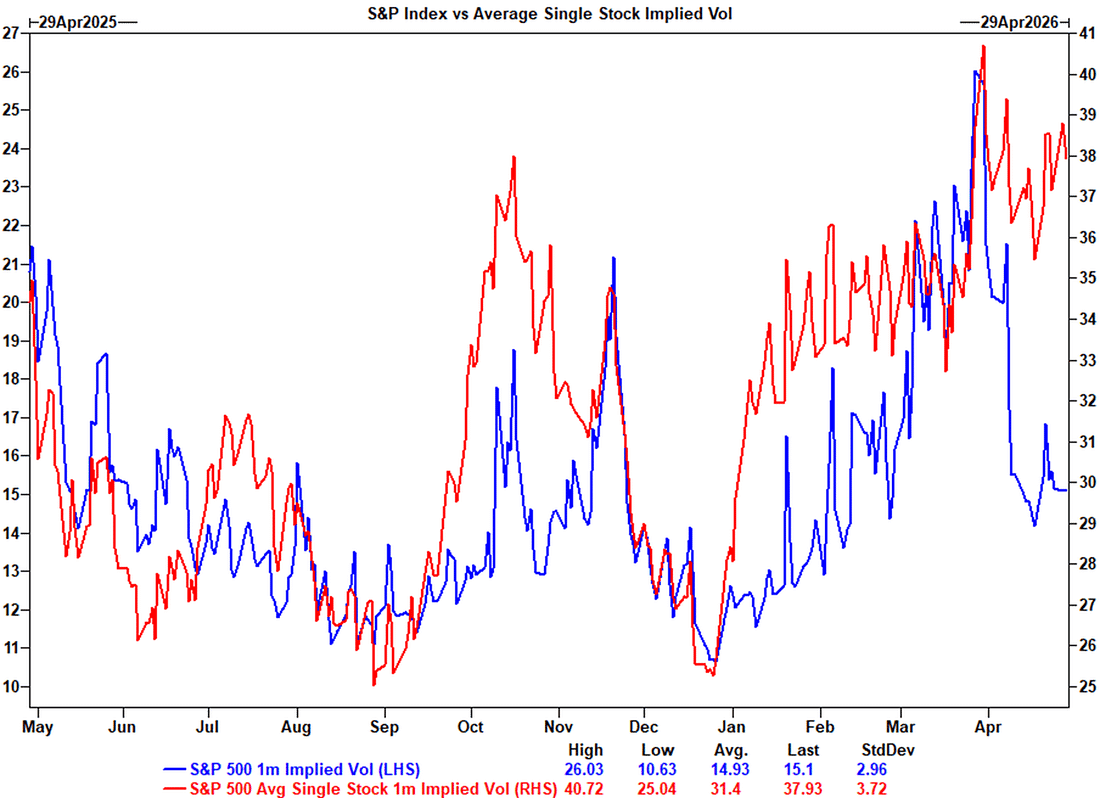
Index vol has come in hard since the geopolitical spike, so on the surface, it all looks calmer. But scratch that layer and nothing’s really settled. Single stock vol across the S&P is still holding up.
What that tells you is the market’s moved away from trading everything as one block. It’s no longer just beta lifting or sinking the whole index. Now it’s names getting picked off one by one, winners bid, losers hit.
And the gap between single stock vol and index vol? It’s stretched right out—basically at the top of the range on both a 1-year and 5-year view.
That’s not normal. That’s a market doing a lot of work under the surface.
So while the index looks calm, there’s plenty going on underneath. Two-way flow, more disagreement, less of that clean one-direction push we had before.
It lines up with everything else:
- CTA support isn’t what it was.
- Retail’s chasing themes instead of the index.
- Flows aren’t all leaning the same way anymore.
So the feel changes. You’re not just riding the index higher, you’re navigating what’s inside it.
On the surface it’s smooth. Underneath, it’s moving.
4. Retail
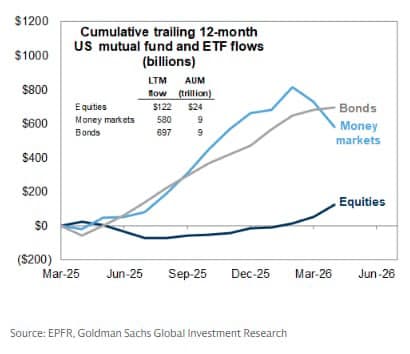
This is one of those quiet seasonal shifts that never gets much airtime—until you start to feel it in the tape.
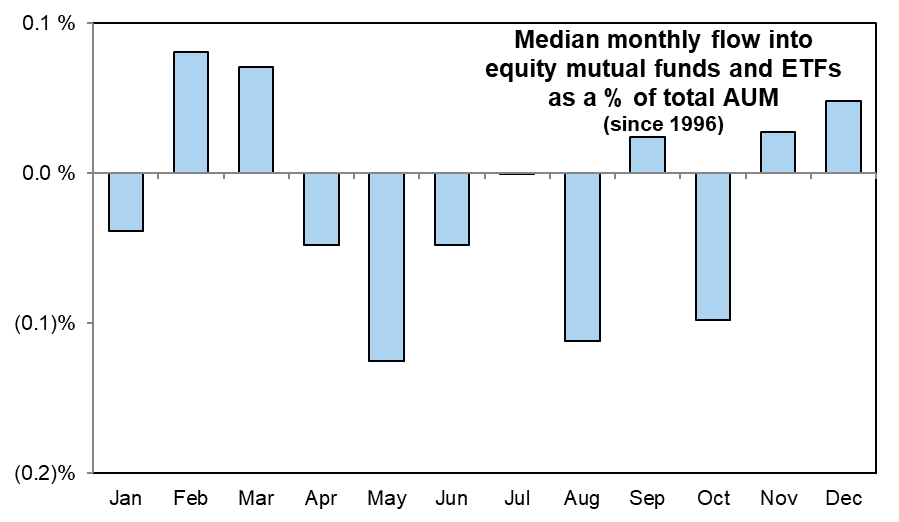
May tends to lean the other way for equities. Not in a dramatic, headline-grabbing sense, just a steady drip out of mutual funds and ETFs. Nothing violent, just a background current that’s no longer pushing in your favor.
And the timing fits. That post-tax-season bid and the refund money that quietly fuels retail buying through April start to fade. Less fresh cash coming in just as some of the bigger players begin to tidy up books.
So the feel of the market changes. You go from dips getting caught almost automatically, to something a bit more two-sided… sometimes even a touch heavy.
It doesn’t break the rally on its own. But it does take away one of those invisible supports that made everything feel easy on the way up.
And right now, that’s the shift. It’s not that the market can’t go higher—it’s that it has to work harder to get there.
5. Leverage
Retail’s not just buying the market anymore; they’ve zoomed in and set up camp in the high-vol corners.
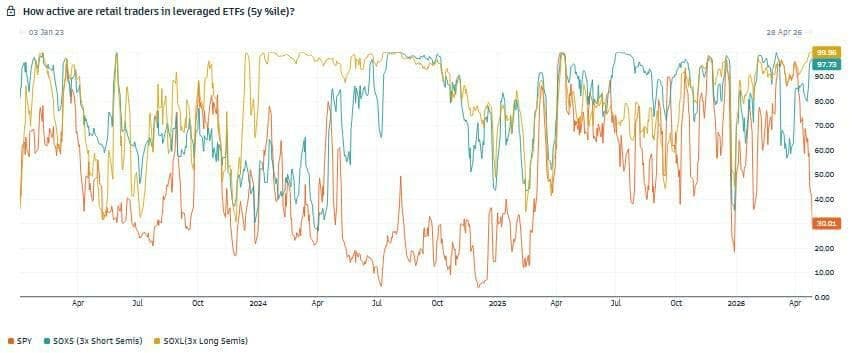
Instead of leveraging the index, they’re going straight at semis, and doing it with size on both sides. Flows into the 3x long and 3x short semi ETFs are sitting up in the 97th to 99th percentile on a 5-year lookback. That’s not positioning, that’s a bar fight.
You’ve got people leaning hard into the AI winners with leverage, and at the same time others fading it just as aggressively. It’s no longer a one-way story—it’s a crowded two-way trade.
That’s usually what happens when a theme gets mature. The easy money’s been made, the narrative is fully priced in, and now it turns into a battleground where everyone thinks they’ve got the timing right.
So instead of broad participation lifting everything, you’ve got concentration. A lot of risk is packed into a very tight part of the market.
And when it’s set up like that, it doesn’t take much to tip it one side, get squeezed, and it moves fast.
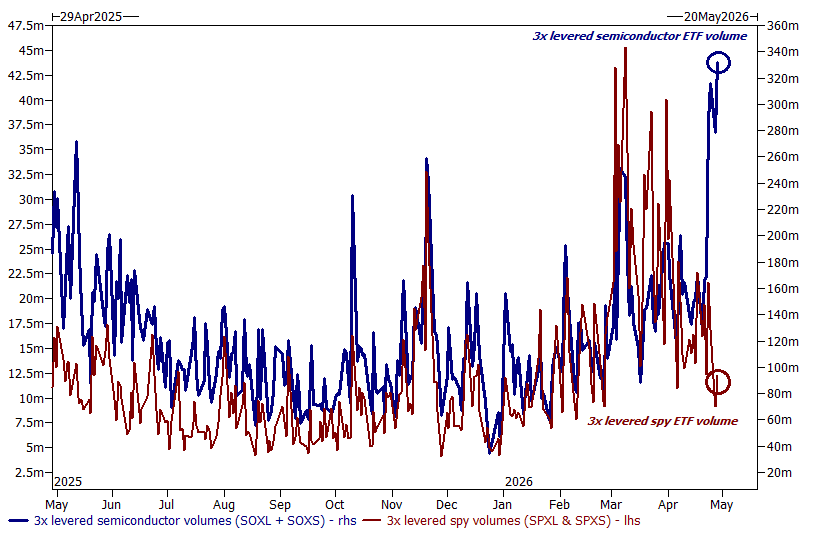
Retail participation in levered index products has come in, and persisting interest in sector trading will result in more violent thematic moves under the hood.
6. Gamma
Taken together with the other factors outlined, the dealer gamma setup is conducive to orderly price action in the near term. According to Goldman’s models, dealers are long gamma at spot and go longer on sell-offs while going shorter on rallies.
In other words, downside moves will be muted. Institutional positioning and month-end selling might make rallies more challenging, and moves to the upside will be exacerbated from dealer gamma hedging.
7. Pensions
US pensions are modelled to SELL $27bn of US equities for month-end. $27bn to sell ranks in the 86th percentile amongst all buy and sell estimates in absolute dollar value over the past three years and in the 93rd percentile going back to Jan 2000.
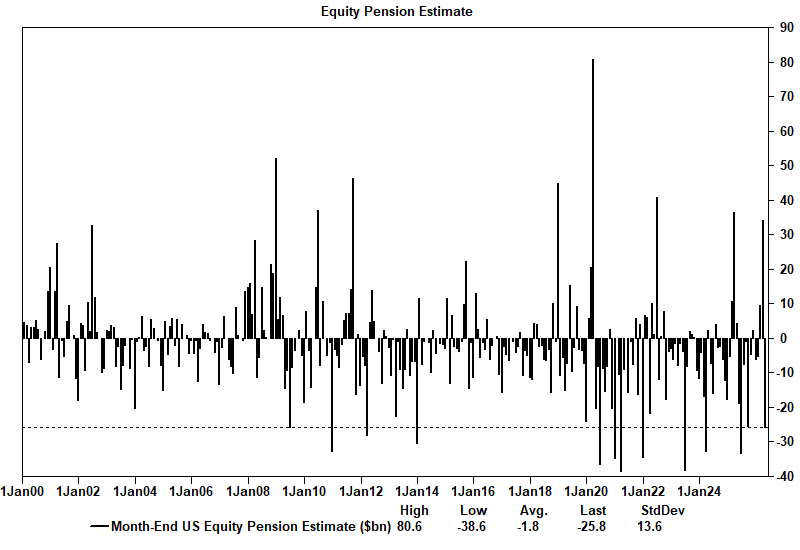
This estimate is the largest non-quarterly sales figure we have seen in our dataset going back to 2000. This means we’ll have some wood to chop through as we close April out.
8. Institutional Length
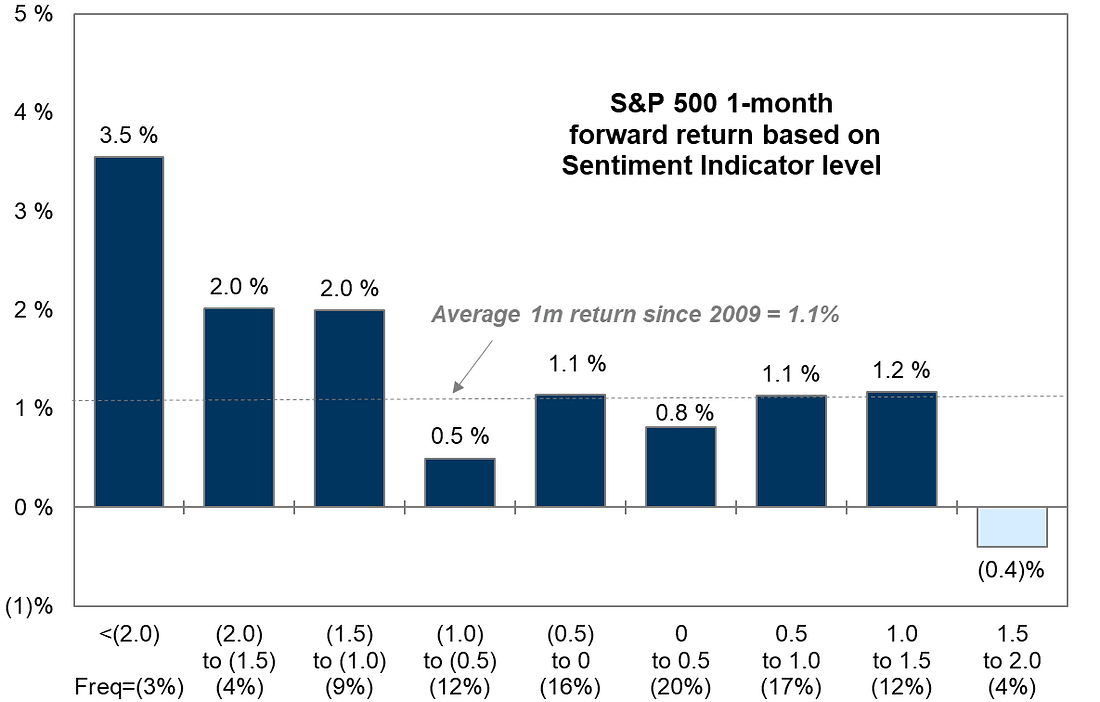
Goldman’s sentiment gauge pushing up to +1.5 is one of those signals the market tends to shrug off right up until it doesn’t. On its own, stretched positioning is not a trigger, it’s a condition. But what matters here is the backdrop it’s sitting in. This is not a market grinding higher on falling volatility and stable inputs. This is a market pressing highs while oil is up nearly 100 percent year on year, yields are climbing, and the real economy is starting to feel the squeeze.
That’s where the signal changes character. When positioning gets this extended into a supportive macro, it can stay elevated. When it gets stretched into a deteriorating cost environment, it becomes fragile. You are no longer dealing with conviction driven buying. You are dealing with crowded exposure that has less tolerance for adverse moves.
In other words, the market is leaning long at the exact moment the underlying inputs are becoming less forgiving. Oil is tightening financial conditions from the outside, yields are doing it from within, and sentiment is telling you there is not much dry powder left to absorb a shock.
That is the setup you want to respect. Not because it guarantees a reversal, but because it raises the probability that when something does break, it moves faster than expected.
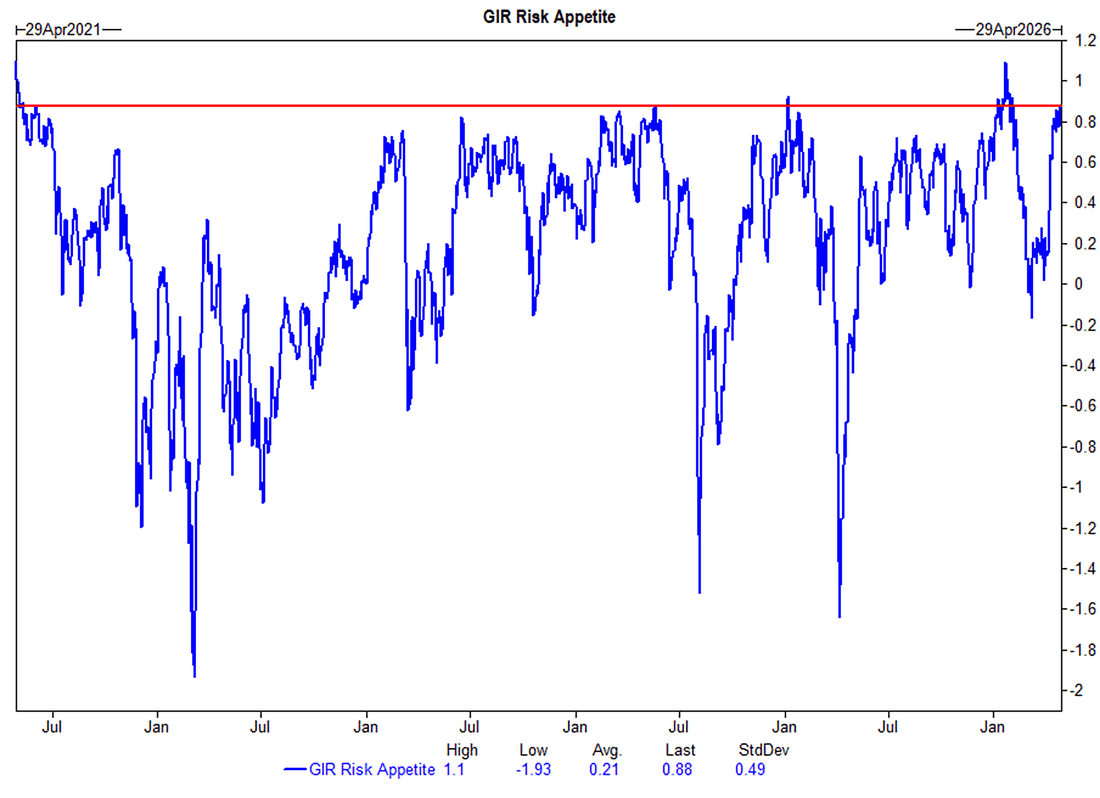
This is one of those signals that does not shout, but when it moves like this you pay attention.
The Risk Appetite Indicator has gone from the middle of the pack to effectively maxed out in the space of a month, jumping from the mid 30s percentile to the 99th. That is not a gentle build, that is a full rotation into risk.
And when you see a move like that, it is rarely about new money stepping in with fresh conviction. More often it is a sign that everyone who wants to be in is already there.
That is where the setup changes.
When positioning gets that crowded, the market becomes much more sensitive. It does not need a major shock, just something that leans against the consensus. Not because the story is wrong, but because there is very little left on the sidelines to keep it moving if it hesitates.
So it is not about calling the top. It is about recognizing the conditions.
The market is fully leaned into risk, the consensus is crowded, and in that kind of environment, it does not take much to trigger a reset.
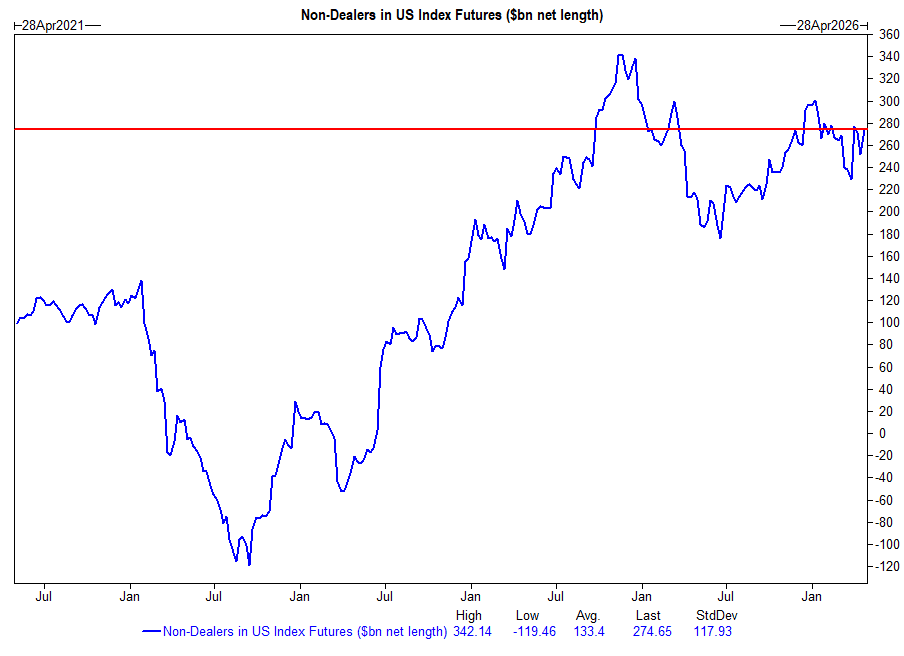
Overall leverage has come in a touch, but let’s not kid ourselves,it is still sitting up near the top of the range.
Gross leverage slipped slightly to just over 308 percent after last week’s de grossing, the biggest trim we have seen since September. But even after that, you are still looking at the mid-80s percentile on a one-year view and pushing the high-90s on a five-year lookback. That is not light positioning. That is still a crowded room, just with a few people stepping back from the bar.
At the same time, non-dealer positioning in US index futures is sitting around the high 80th percentile. So the exposure is still there. The market is still leaning long.
What that changes is the character of the tape.
When positioning is this full, you do not get the same kind of violent squeezes higher. There are fewer people left to chase. The upside becomes harder work.
But on the flip side, it does not take a major shock to see some of that exposure come off. Not a collapse, just a clearing out. A bit of air is coming out of what has been a very straight line move higher.
So near term, it leans toward a correction. Not because something is broken, but because the market has been running a bit too clean for too long.
And if that happens, it is probably healthy. It shakes out some of the excess, resets positioning, and gives the next move something more solid to build on.
9. Buybacks
April earnings are in, and that flips the switch on buybacks.
Companies are coming out of blackout and stepping back into the market, so you start to get that steady corporate bid again. Roughly 40 percent of names are already in their open window, and that number builds from here, running through to mid-June.
And the scale is not small. Year-to-date authorizations are north of $500bn.
This is the part of the tape that does not make noise, but you feel it. It is not chasing, it is not reactive. It just sits there, consistently taking stock back in.
So while some of the faster money flows are fading or turning more two-way, buybacks step in as a more reliable undercurrent.
They do not stop a pullback if one gets going, but they tend to slow it down. And over time, they give the market something to lean on once the froth gets cleared out.
In this environment, that kind of steady demand matters.
10. Seasonality
The history book gets interesting here, because May tends to tell a very specific story.
The broad market does fine, nothing spectacular. The S&P has averaged a small gain over this window, just a steady grind higher.
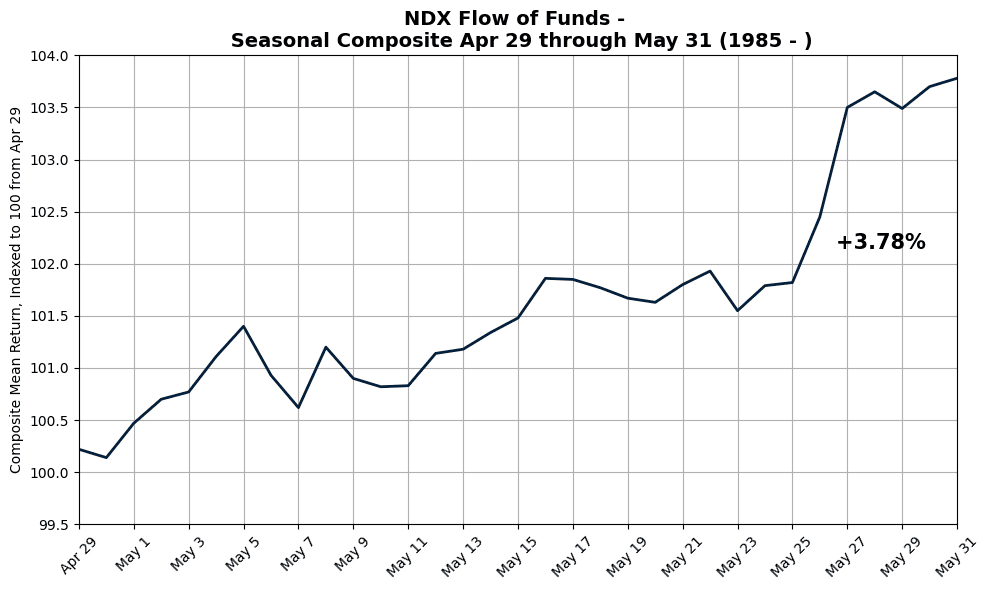
But the Nasdaq is a different animal. Over the same stretch, it has historically put up a much stronger move.
That gap matters.
It tells you that when the market finds its footing into May, the leadership tends to concentrate. It is not broad based strength lifting everything. It is growth, tech, the long duration names doing the heavy lifting.
And that fits the current tape almost too well.
You have a market still leaning into narrative, still anchored around AI and capex themes, and when that is the case, flows do not spread out evenly. They cluster.
So if the market holds together, history suggests the same pattern. The index can grind, but the real momentum tends to show up in the Nasdaq.
It is not a guarantee, but it is a tendency. And in a tape like this, tendencies are often enough.
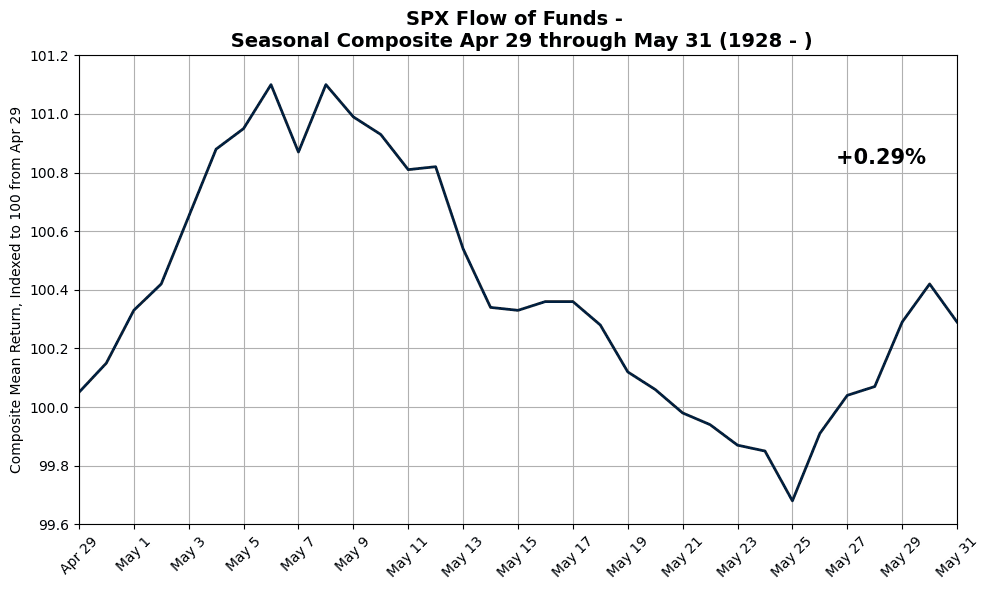
May tends to split the tape in a way people often overlook.
On one side, the Nasdaq has a strong seasonal tailwind. It is one of its better months of the year. On the other, the S&P does not quite keep pace and actually ranks toward the weaker end of its seasonal profile.
That divergence is telling.
It speaks to a market where leadership narrows rather than broadens. The gains are there, but they are not evenly distributed. They concentrate in the growth complex.
And that lines up with what we are seeing now.
The focus is still firmly on secular growth, the AI capex story is still pulling capital in, IPO activity is picking up, and earnings continue to provide the catalysts that keep attention anchored in tech.
So if the pattern holds, you are not looking at a market that struggles across the board. You are looking at one where the index does just enough, while the Nasdaq continues to carry the weight.
Same market, different engines.
Author

Stephen Innes
SPI Asset Management
With more than 25 years of experience, Stephen has a deep-seated knowledge of G10 and Asian currency markets as well as precious metal and oil markets.