Gold Weekly Forecast: Bearish pressure builds up as Middle East tensions offset USD weakness
- Gold failed to capitalize on soft US inflation data and registered a second consecutive weekly loss, testing the key $4,000 level.
- Tensions in the Middle East escalate further as the US and Iran continue to exchange strikes.
- The near-term technical outlook reaffirms the bearish stance.

Gold (XAU/USD) struggled to benefit from the broad-based selling pressure surrounding the US Dollar (USD) as tensions in the Middle East escalated further. The preliminary July Purchasing Managers’ Index (PMI) from the United States (US) will be the only data release that has the potential to trigger a market reaction next week.
Easing Fed rate hike bets fail to lift Gold
Gold started the week with a bearish gap and lost nearly 3% on Monday as markets reacted to news of intensifying military aggression between the US and Iran. The US Central Command announced on Sunday that it launched strikes against dozens of Iranian military targets for the second consecutive day, and Iran retaliated by targeting US military sites in Bahrain, Kuwait, Oman and Jordan.
On Tuesday, the USD came under heavy selling pressure in the early American session after the US Bureau of Labor Statistics (BLS) reported that annual inflation, as measured by the change in the Consumer Price Index (CPI), softened to 3.5% in June from 4.2% in May. This print came in well below the market expectation of 3.8% and caused investors to sharply dial back bets for a rate hike as early as July. XAU/USD gathered bullish momentum as a result and rose more than 1% on the day.
Although the USD sell-off continued on Wednesday, with the producer inflation data for June also arriving weaker than analysts’ estimates, Gold struggled to extend its recovery as the US and Iran continued to exchange strikes. After failing to stabilize above $4,100, Gold turned south in the second half of the week and declined below $4,000.
Federal Reserve (Fed) Chairman Kevin Warsh’s comments during his two-day congressional testimony helped the USD stabilize and didn’t allow Gold to regain its traction.
Warsh’s testimony before the House Financial Services Committee scored 7/10 on the FXS Speechtracker, as he signalled a steady, firmly anti-inflation stance. The key remark that “if we get policy right – and we will – the inflation surge of the last five years will be a thing of the past” reinforced confidence in the Fed’s ability to subdue price pressures, backed by explicit “no tolerance” language on persistent inflation.
On his second day, he called the recent CPI reading an “imperfect gauge” of underlying inflation and framed AI as a source of both disruption and long-term job and wage gains. The comment that whether AI is inflationary “is up to the Fed” underscored his confidence in policy control.
The US carried out strikes for the sixth night in a row on Friday, this time targeting civilian infrastructures, including power facilities and a train station, in the south of Iran. In an exclusive article published late Thursday, Reuters said that Iran has asked Yemen’s Houthi militia to stand ready to close the Red Sea Oil route if the US strikes Iranian power infrastructure, posing a potent new threat to global energy supplies. After losing about 2% on Thursday, Gold found it difficult to gather recovery momentum on Friday and remained in the lower half of its weekly range.
Middle East continues to dictate Gold’s action
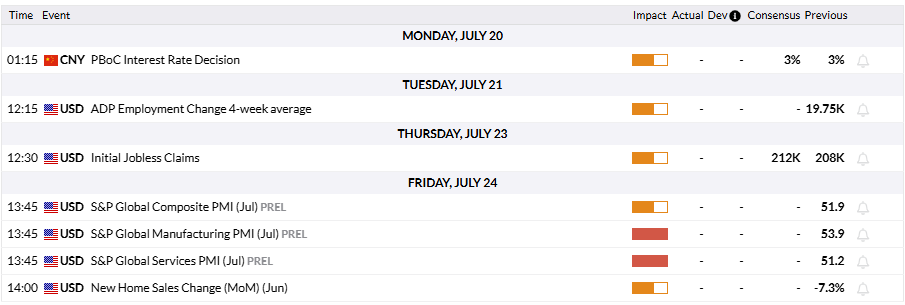
The US economic calendar will feature preliminary S&P Global Purchasing Managers’ Index (PMI) data for July on Friday. In case either the headline Manufacturing or the Services PMI come in below 50, which would point to a contraction in the economic activity of the respective sector, the USD could struggle to find demand and help XAU/USD edge higher heading into the weekend. Conversely, the USD is likely to hold its ground and limit the pair’s upside if both PMIs remain above 50 and the survey’s findings highlight that input costs showed no signs of slowing.
Until Friday’s PMI data, investors will pay close attention to developments in the Middle East.
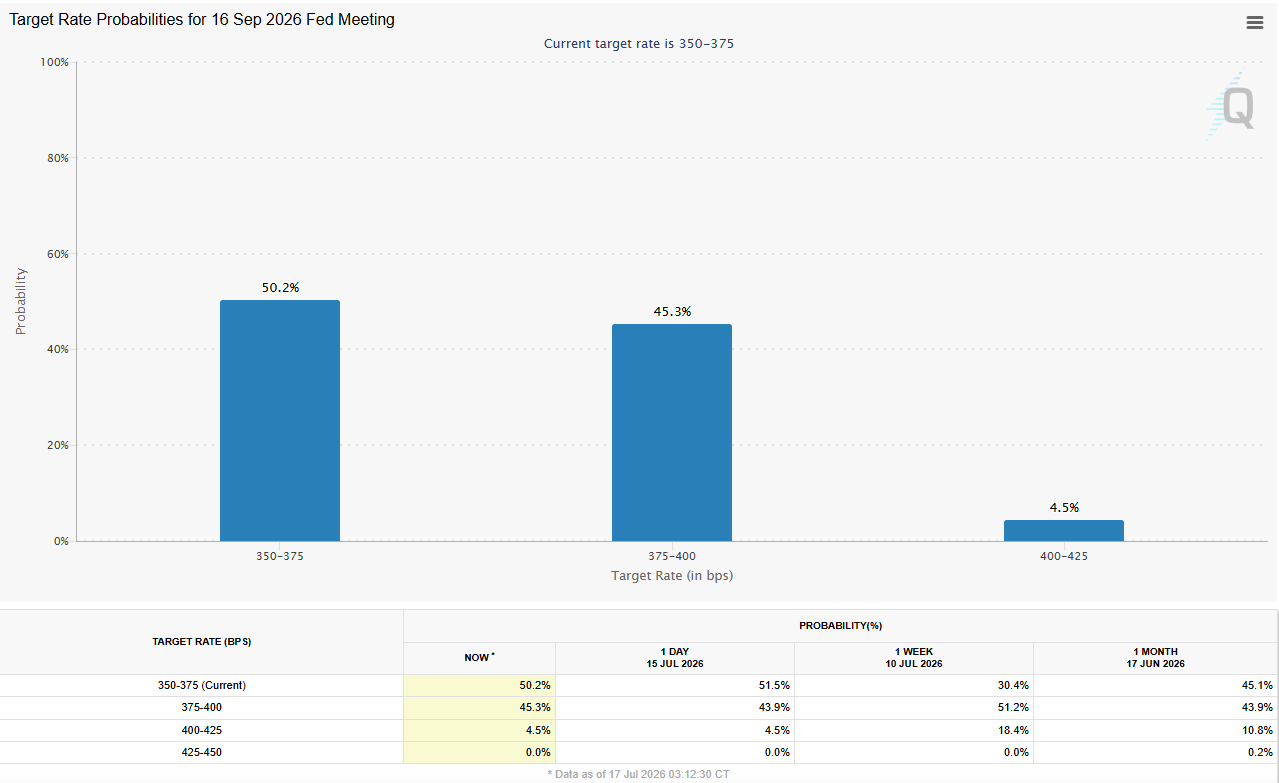
According to the CME FedWatch Tool, the probability of a 25 basis points (bps) Fed interest rate increase in July dropped to about 10% from nearly 35% before the weak CPI and PPI readings.
In the absence of high-impact data releases, investors are unlikely to reassess the probability of a July hike. However, another leg higher in crude Oil prices, with the US and Iran steering further away from diplomacy, could suggest that the recent decline in monthly inflation is a one-off and force the Fed to consider a rate hike in September. The CME FedWatch Tool shows that there is a 50% chance of the US central bank taking a tightening step in September.
Since the beginning of the conflict in the Middle East, Gold has come under pressure anytime markets reacted to rising Oil prices and their potential impact on global inflation. Hence, a similar reaction could be seen in the near term, with XAU/USD extending its downtrend on escalating tensions in the Middle East. On the other hand, Gold could stage a rebound if the US and Iran decide to take a step back and give diplomacy another chance.
ING strategists Warren Patterson and Ewa Manthey noted that lower energy costs helped ease inflation pressures in the US and reduced expectations of near-term Fed tightening. "Markets now price only a 12% chance of a July rate hike, down from almost 31% a week ago,” they said, adding that they still believe Gold’s “upside could remain limited in the near term if Middle East tensions continue to support energy prices and keep inflation risks elevated.”
Gold technical analysis: Bears retain control
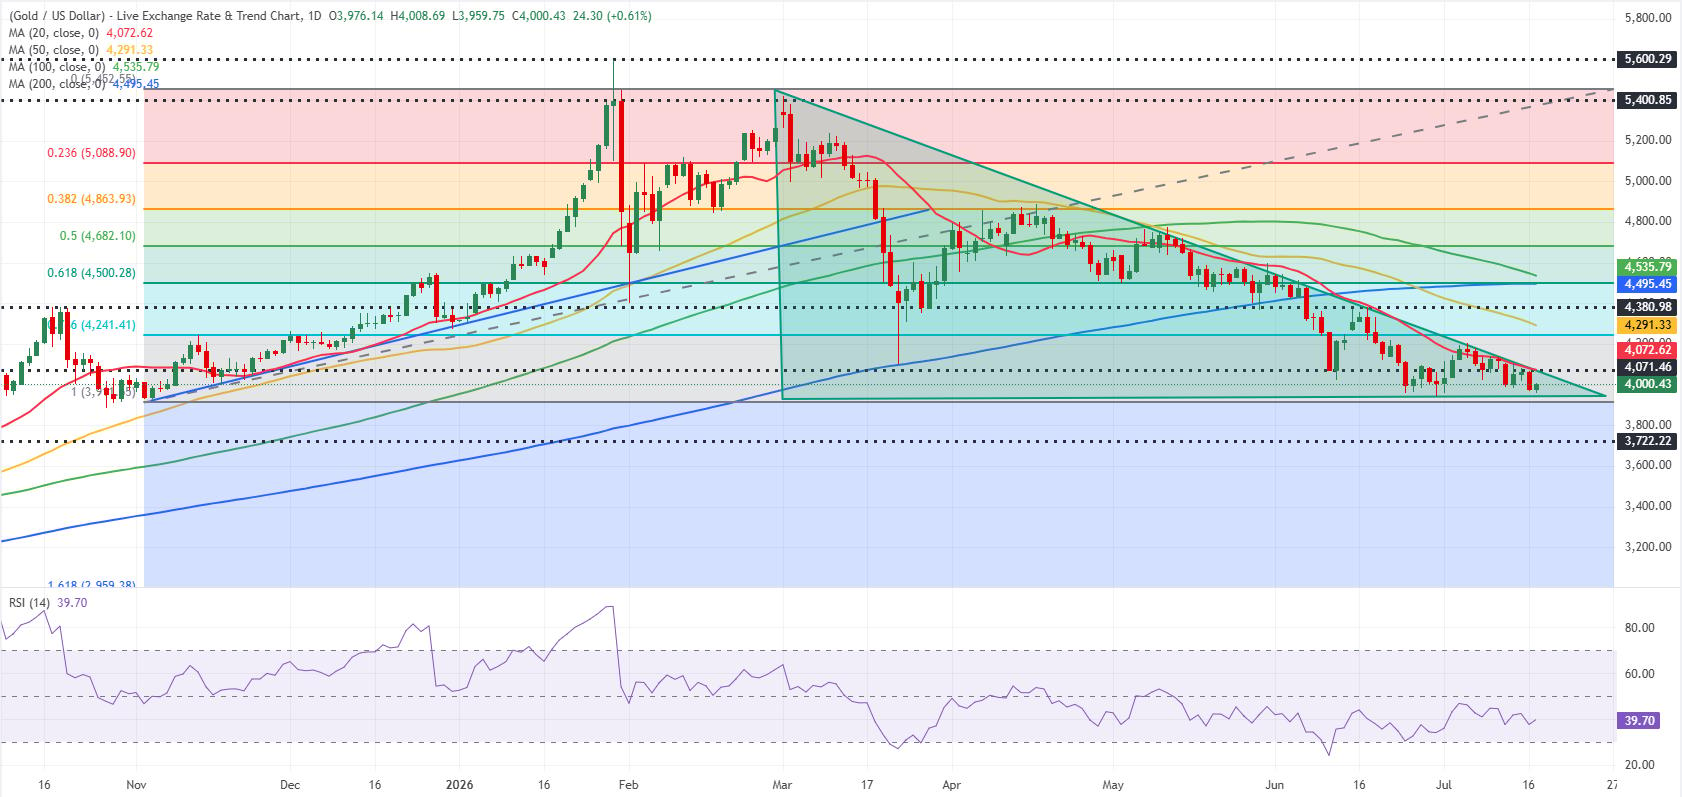
Gold remains below the descending trend line and continues to trade below the 20-day Simple Moving Average after failing to reclaim this level multiple times. Additionally, the Relative Strength Index (RSI) indicator on the daily chart sits at around 40, suggesting that the bearish stance remains intact in the near term.
On the downside, a key support area aligns at $3,950-$3,920, where the lower limit of the descending triangle formation and the beginning point of the November-February trend align. If Gold breaks below this region, $3,800 (static level, round level) could be seen as the next support level ahead of $3,720 (static level).
Looking north, the first technical resistance could be spotted at $4,070-$4,100 (20-day SMA, descending trend line, round level). If XAU/USD manages to clear that hurdle and starts using it as support, $4,240 (Fibonacci 78.6% retracement of the November-February uptrend) could be seen as the next resistance level before $4,290 (50-day SMA).
Gold FAQs
Gold has played a key role in human’s history as it has been widely used as a store of value and medium of exchange. Currently, apart from its shine and usage for jewelry, the precious metal is widely seen as a safe-haven asset, meaning that it is considered a good investment during turbulent times. Gold is also widely seen as a hedge against inflation and against depreciating currencies as it doesn’t rely on any specific issuer or government.
Central banks are the biggest Gold holders. In their aim to support their currencies in turbulent times, central banks tend to diversify their reserves and buy Gold to improve the perceived strength of the economy and the currency. High Gold reserves can be a source of trust for a country’s solvency. Central banks added 1,136 tonnes of Gold worth around $70 billion to their reserves in 2022, according to data from the World Gold Council. This is the highest yearly purchase since records began. Central banks from emerging economies such as China, India and Turkey are quickly increasing their Gold reserves.
Gold has an inverse correlation with the US Dollar and US Treasuries, which are both major reserve and safe-haven assets. When the Dollar depreciates, Gold tends to rise, enabling investors and central banks to diversify their assets in turbulent times. Gold is also inversely correlated with risk assets. A rally in the stock market tends to weaken Gold price, while sell-offs in riskier markets tend to favor the precious metal.
The price can move due to a wide range of factors. Geopolitical instability or fears of a deep recession can quickly make Gold price escalate due to its safe-haven status. As a yield-less asset, Gold tends to rise with lower interest rates, while higher cost of money usually weighs down on the yellow metal. Still, most moves depend on how the US Dollar (USD) behaves as the asset is priced in dollars (XAU/USD). A strong Dollar tends to keep the price of Gold controlled, whereas a weaker Dollar is likely to push Gold prices up.
Author

Eren Sengezer
FXStreet
As an economist at heart, Eren Sengezer specializes in the assessment of the short-term and long-term impacts of macroeconomic data, central bank policies and political developments on financial assets.
















