Gold (XAU/USD) likely tracing out a wave four triangle – Here’s why it’s not done yet

Gold is showing clear evidence that it remains in Wave 4, unfolding most likely as a contracting triangle. Recent price action invalidates an impulsive Wave (B) due to overlap with Wave 1 territory, ruling out the idea that Wave 5 has already begun. Instead, the internal structure and behavior strongly support a continued correction with further legs (D) and (E) still ahead before the final breakout.
Wave structure context: From the wave three high to current position
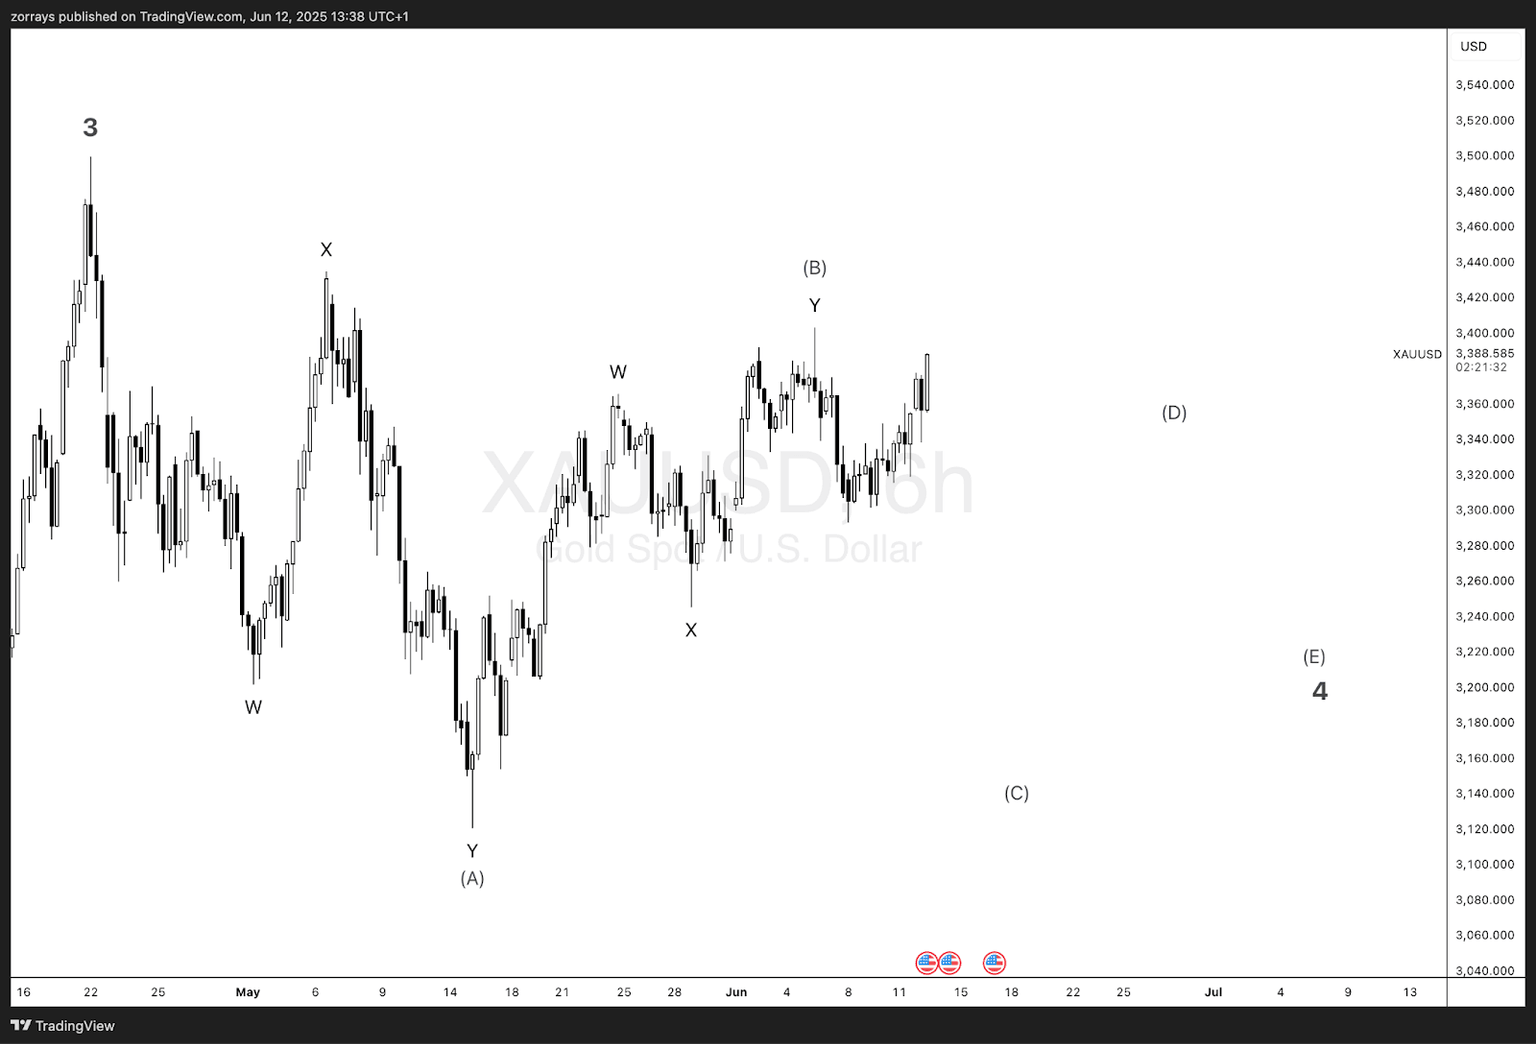
From the confirmed Wave 3 top in early May, gold began a complex correction. Initially, price traced out a W-X-Y double zigzag, completing what is labeled here as Wave (A). The rally from that low has taken on a corrective character, producing overlapping segments and failing to show impulsive momentum—suggesting it is Wave (B) of a larger triangle pattern.
Here's how the larger wave map appears:
- Wave 3 Top.
- W-X-Y into (A).
- W-X-Y forming (B).
- Projected legs for (C)-(D)-(E) remain.
This subdivision supports the case that we are mid-way through a Wave 4 triangle, not in the early stages of Wave 5.
Key invalidations supporting the triangle hypothesis
A critical point invalidating the Wave 5 count is the overlap into Wave 1 territory. Per standard Elliott Wave guidelines, Wave 4 must not enter Wave 1’s price range in motive sequences. The current (B) leg has done exactly that—meaning any attempt to label the recent rise as the start of a motive wave is technically flawed.
Additionally:
- The advance into (B) is not impulsive: it lacks the clean 5-wave subdivision.
- There is no typical acceleration or extension seen in Wave 3 or 5 patterns.
- The entire move appears better classified as a complex corrective W-X-Y sequence.
These structural traits reinforce the idea that the price is still in a Wave 4 triangle, likely mid-way through or approaching the end of Wave (C) with (D) and (E) still pending.
Market Behavior Consistent with Wave 4 Personality
Wave 4s, particularly in commodities like gold, are notoriously complex and tend toward triangular or sideways corrections. This fits the current price behavior precisely:
Lateral drift, not deep retracements
Sharp internal retracements typical of triangle waves
Market indecision and compression, typical ahead of final breakouts
What’s especially telling is that sentiment has been shifting but without directional follow-through—indicative of a market coiling before the thrust that ends a triangle.
Author

Zorrays Junaid
Alchemy Markets
Zorrays Junaid has extensive combined experience in the financial markets as a portfolio manager and trading coach. More recently, he is an Analyst with Alchemy Markets, and has contributed to DailyFX and Elliott Wave Forecast in the past.


