Gold Weekly Forecast: Precious metal finds support but upside potential remains limited
- Gold managed to rebound from monthly lows but struggled to gather momentum.
- September US inflation data could ramp up market volatility.
- The technical outlook highlights bulls’ hesitancy in the near term.

After bearish action seen in the first half of the week, Gold (XAU/USD) staged a recovery to end the week marginally higher. September inflation data from the United States (US) and headlines surrounding the Middle East conflict could drive the precious metal’s action in the near term.
Gold benefits from retreating US yields
Gold struggled to make a decisive move in either direction on Monday and ended the day virtually unchanged. Rising US Treasury bond yields made it difficult for the precious metal to gather strength, but a risk-averse market atmosphere allowed it to hold its ground amid rising fragmentation fears in the Eurozone.
As the 10-year US Treasury bond yield corrected lower on Tuesday, the US Dollar (USD) also weakened against its major rivals. In turn, XAU/USD rebounded modestly to close about 0.6% higher.
Following a short-lasting pause, US T-bond yields stretched higher and the 10-year reference hit its highest level since April 2002 at 5.36% on Wednesday, while Gold dropped below $4,100 for the first time in two months. Later in the American session, the minutes from the Federal Reserve’s (Fed) September policy meeting showed that most participants considered one more interest rate increase by the end of the year likely appropriate. As this development caused US T-bond yields to retreat, Gold managed to erase a small portion of its losses in the second half of the day.
On Thursday, crude Oil prices surged higher on news claiming that the Pentagon told US Central Command (CENTCOM) to conclude preparations for resuming major combat operations in Iran. According to Axios, US President Donald Trump hasn't made any final decisions or included a specific date for launching strikes, but the US and Israeli sources said it could happen before the US midterm elections and possibly the Israeli elections a week earlier. Although Gold benefited from an extended correction in bond yields, it failed to gather bullish momentum as this headline revived fears over a deepening conflict in the Middle East and its potential impact on inflation.
Nevertheless, in a Truth Social post late Thursday, Trump said that they are having productive discussions with Iran and claimed that Oil is "flowing in record numbers of barrels through the Hormuz Strait." He further clarified that the US won’t attack Iran ahead of the Midterm elections in early November. In the meantime, Fed Governor Christopher Waller said that they need to hike the policy rate further but added that they also need to be flexible about the pace. After closing modestly higher on Thursday, Gold extended its rebound to the $4,200 region on Friday as this headline helped geopolitical tensions ease.
According to Deutsche Bank, US Treasuries saw “a sharp intraday turnaround” on Thursday, with the 10-year yield “initially reaching an intraday peak of 5.35%, before ultimately closing down -5.7bps on the day at 5.23%.” The bank adds that “Fed pricing also shifted a bit dovishly,” after Fed Governor Waller remarked that further hikes “do not need to come at consecutive meetings,” prompting investors to reassess the expected pace of tightening.
Gold investors await US inflation data
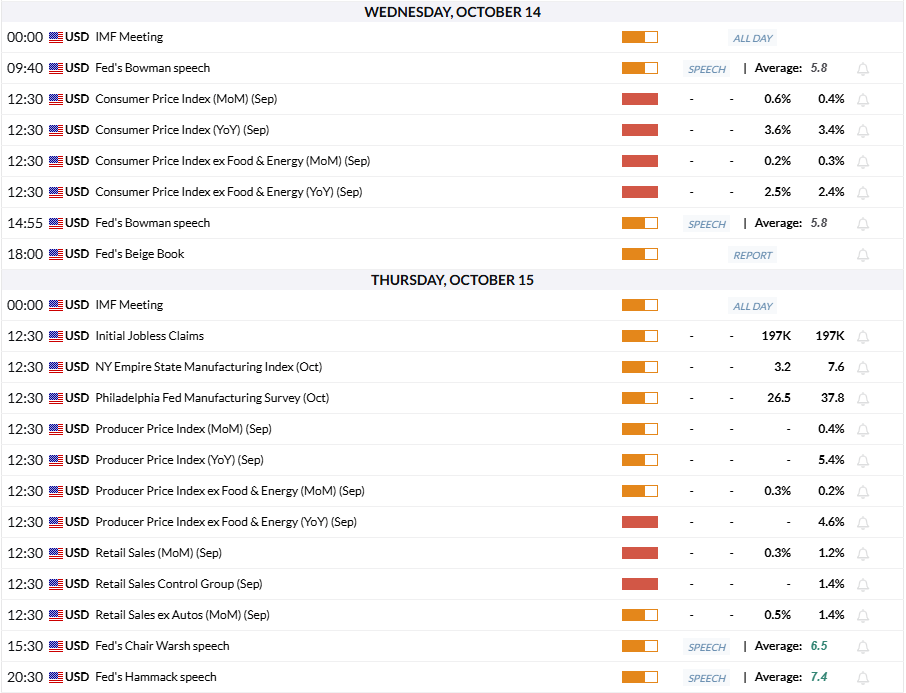
Bond markets in the US will remain closed on Monday in observance of the Columbus Day holiday. On Wednesday, the US Bureau of Labor Statistics will publish the Consumer Price Index (CPI) data for September.
Investors expect the CPI to rise 0.6% on a monthly basis and forecast core CPI to increase by 0.2% in this period. According to the CME FedWatch Tool, markets are currently pricing in about an 80% probability of a Fed policy hold at the next meeting, and a nearly 70% chance of the next rate increase coming in December.
While a stronger-than-expected monthly CPI print might not be able to convince markets of a rate hike in October, market positioning suggests that there is room for additional strength if hot inflation data confirms another tightening move before the end of the year. In this scenario, US yields could regain traction and put Gold under bearish pressure. On the other hand, a soft reading could have the opposite effect, opening the door for an extended rebound in the precious metal.
Market participants will continue to pay close attention to headlines coming out of the Middle East. If crude Oil prices continue to edge lower with investors growing increasingly optimistic about an end to the conflict, Gold could gather bullish momentum. Conversely, Oil prices could rise again and Gold could turn south if there are signs of a potential escalation in the conflict.
TD Securities analysts note that the current wave of Gold buying is being driven by a broad set of macro and geopolitical concerns, including “geopolitical risk, fiscal concern, Dollar debasement, de-dollarization and stagflation concerns.” The bank argues that, given the nature of these drivers, “we expect the appetite to be more persistent and ultimately hold firm in the face of surging real rates.” Against this backdrop, TD Securities adds that “we continue to see the stage being set for Gold to disconnect from real rates further and begin a new bull run into 2027.”
Gold technical analysis: No signs of a buildup in bullish momentum
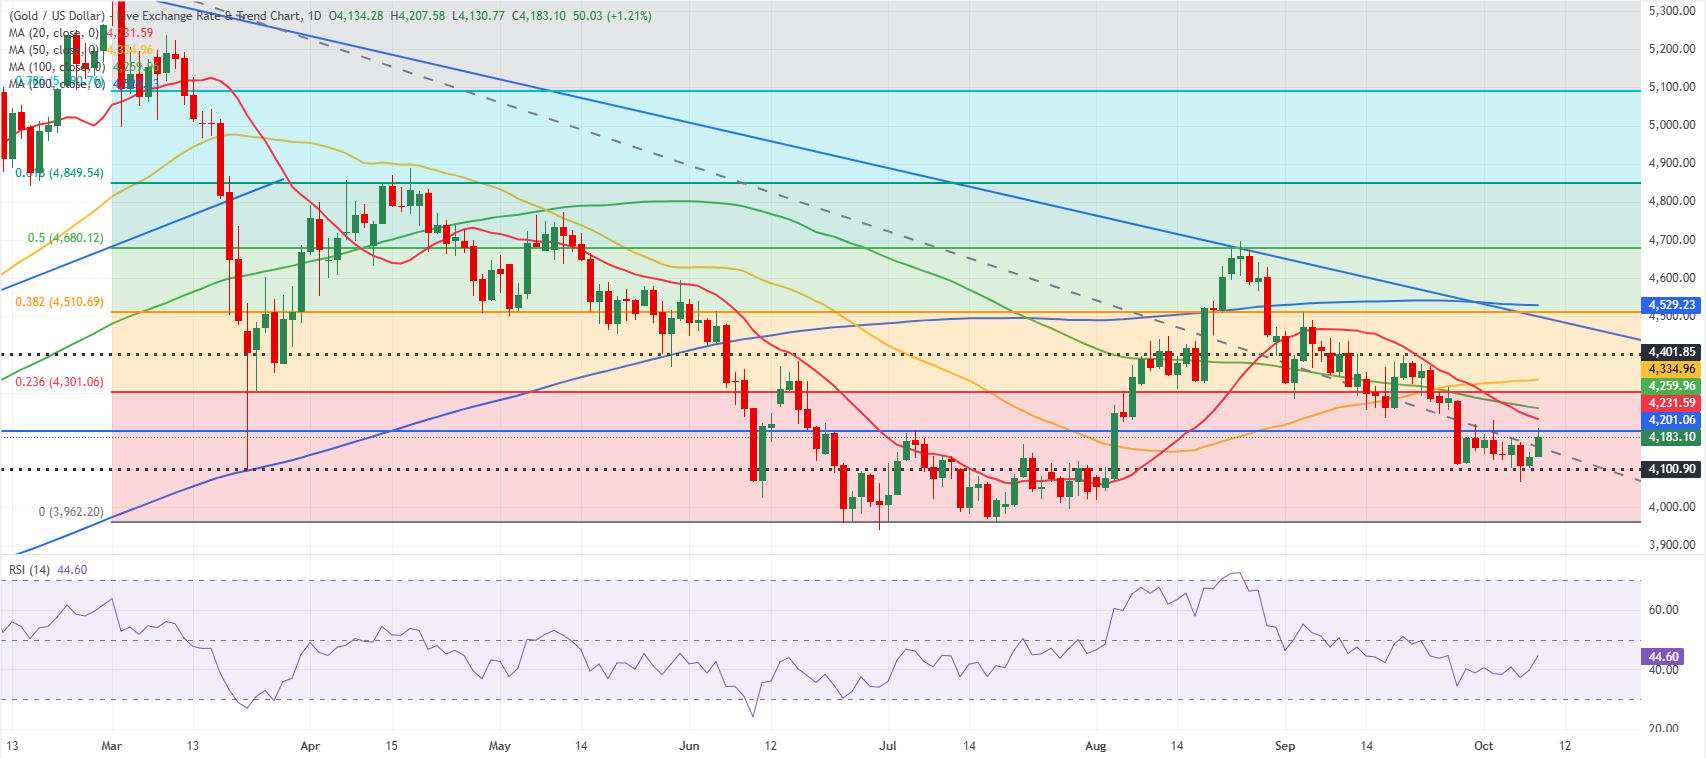
The Relative Strength Index (RSI) indicator on the daily chart rebounds but remains below 50, suggesting Gold has yet to signal a bullish reversal. Additionally, XAU/USD remains below the 20-day, 50-day, 100-day and 200-day Simple Moving Averages (SMA).
In case Gold stabilizes above $4,200 (static level) and confirms it as support, it will likely face a stiff resistance at $4,260-$4,300, where the 100-day SMA and the Fibonacci 23.6% retracement of the March-August downtrend meet. If this hurdle is cleared, a steady climb toward $4,510-$4,530 (Fibonacci 38.2% retracement, 200-day SMA, ascending trend line) could be seen.
On the downside, a static support level seems to have formed at $4,100 ahead of $4,000-$3,970 (static level, round level, end-point of March-August downtrend).
Gold FAQs
Gold has played a key role in human’s history as it has been widely used as a store of value and medium of exchange. Currently, apart from its shine and usage for jewelry, the precious metal is widely seen as a safe-haven asset, meaning that it is considered a good investment during turbulent times. Gold is also widely seen as a hedge against inflation and against depreciating currencies as it doesn’t rely on any specific issuer or government.
Central banks are the biggest Gold holders. In their aim to support their currencies in turbulent times, central banks tend to diversify their reserves and buy Gold to improve the perceived strength of the economy and the currency. High Gold reserves can be a source of trust for a country’s solvency. Central banks added 1,136 tonnes of Gold worth around $70 billion to their reserves in 2022, according to data from the World Gold Council. This is the highest yearly purchase since records began. Central banks from emerging economies such as China, India and Turkey are quickly increasing their Gold reserves.
Gold has an inverse correlation with the US Dollar and US Treasuries, which are both major reserve and safe-haven assets. When the Dollar depreciates, Gold tends to rise, enabling investors and central banks to diversify their assets in turbulent times. Gold is also inversely correlated with risk assets. A rally in the stock market tends to weaken Gold price, while sell-offs in riskier markets tend to favor the precious metal.
The price can move due to a wide range of factors. Geopolitical instability or fears of a deep recession can quickly make Gold price escalate due to its safe-haven status. As a yield-less asset, Gold tends to rise with lower interest rates, while higher cost of money usually weighs down on the yellow metal. Still, most moves depend on how the US Dollar (USD) behaves as the asset is priced in dollars (XAU/USD). A strong Dollar tends to keep the price of Gold controlled, whereas a weaker Dollar is likely to push Gold prices up.
Author

Eren Sengezer
FXStreet
As an economist at heart, Eren Sengezer specializes in the assessment of the short-term and long-term impacts of macroeconomic data, central bank policies and political developments on financial assets.
















