Gold Weekly Forecast: Bulls to take action with a break above $1,830
- Gold rose this week as 10-year US T-bond yield retreated from two-year highs.
- Key resistance for XAU/USD seems to have formed at $1,830.
- US economic docket will not be offering any high-impact data releases next week.

Gold started the new week on a firm footing and staged a recovery toward $1,800. With buyers managing to lift the precious metal above that key resistance area, XAU/USD extended its rally toward $1,830 before going into a consolidation phase in the second half of the week.
What happened last week
Markets remained relatively quiet on Monday amid a lack of high-tier data releases. Nevertheless, the greenback managed to find demand as Richmond Federal Reserve Bank President Thomas Barkin told the Wall Street Journal that a rate hike in March would be conceivable.
During FOMC Chairman Jerome Powell’s nomination hearing on Tuesday, however, the dollar faced heavy selling pressure and triggered a sharp upsurge in XAU/USD. Powell said that they would need up to four policy meetings to come up with a plan to start reducing the balance sheet. This remark forced the US Dollar Index to erase the gains it recorded after the December minutes showed that some policymakers saw it appropriate to begin the balance sheet runoff following the first rate hike. Powell further added that they could look to shrink the balance sheet “maybe later this year.”
On Wednesday, the monthly report published by the US Bureau of Labor Statistics showed that the Consumer Price Index (CPI) rose to 7% on a yearly basis in December. With this print falling in line with the market consensus, the greenback continued to lose interest as investors reassessed how aggressive the Fed will be when it comes to policy tightening. Additionally, the annual Producer Price Index (PPI) edged lower to 9.7% from 9.8% in November, making it even more difficult for the dollar to shake off the bearish pressure.
In the meantime, the benchmark 10-year US Treasury bond yield, which advanced to its highest level in two years above 1.8% earlier in the week, reversed its direction and retreated to 1.7% area, helping gold preserve its bullish momentum.
On Friday, the US Census Bureau reported that Retail Sales in December declined by 1.9% to $626.8 billion. On a yearly basis, sales were up 19.3% from 2020. The market reaction to these figures was largely muted and gold continued to fluctuate near the top of its weekly trading range.
Next week
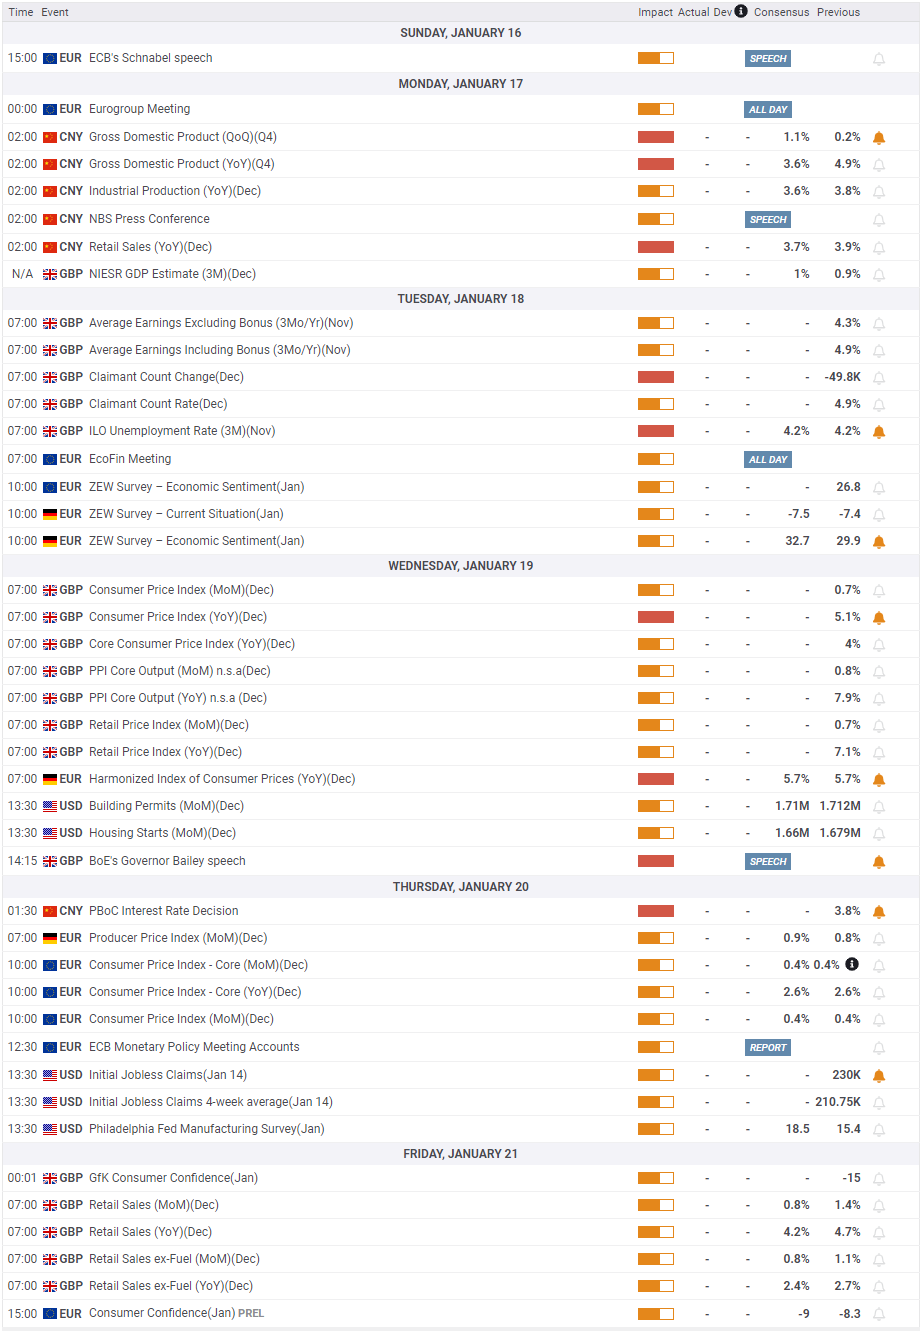
The US economic docket will not be featuring any high-tier data releases next week and investors might turn hesitant to continue to price a less-aggressive Fed policy tightening ahead of the January 26-27 policy meeting. The Fed’s blackout period starts on Saturday, January 15, and FOMC policymakers won’t be able to offer any comments on the policy either. Hence, market participants will watch US Treasury bond yields closely.
In case the 10-year US T-bond yield falls below 1.7% and stays there, the dollar could face renewed selling pressure and allow gold to push higher. On the flip side, another attempt at 1.8% resistance is likely to weigh on XAU/USD.
On Monday, China will release the fourth-quarter Gross Domestic Product (GDP) data. If this report points to a slowdown in the activity of the world’s second-largest economy, markets could turn risk-averse and limit gold’s gains.
December jobs report from the UK on Tuesday and the European Central Bank’s (ECB) Policy Meeting Accounts on Thursday could ramp up the market volatility but these events are unlikely to have a lasting impact on the dollar’s valuation.
Gold technical outlook
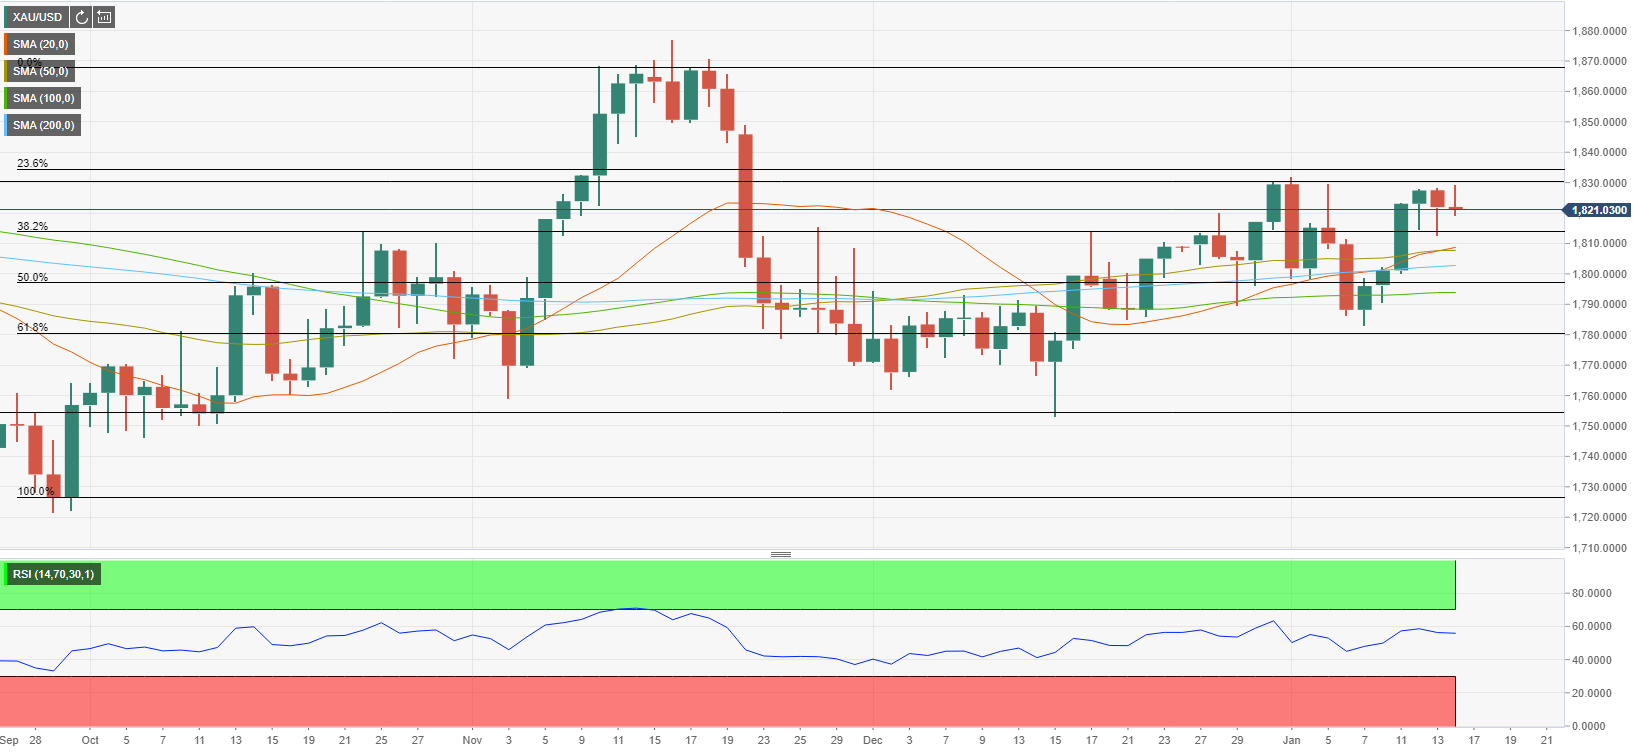
The Relative Strength Index (RSI) indicator on the daily chart stays afloat above 50, suggesting that sellers remain on the sidelines for the time being. Additionally, the 20-day SMA, crossed above the 50-day SMA, confirming the bullish shift. Finally, the pair closed above the 200-day SMA for the fourth straight day.
On the upside, the key resistance area seems to have formed at $1,830, where the Fibonacci 23.6% retracement of the uptrend that started in October and ended in mid-November is located. With a daily close above that hurdle, XAU/USD could target $1,850 (static level) ahead of $1,870 (December highs, static level).
On the flip side, $1,800 (200-day SMA, Fibonacci 50% retracement) aligns as key support. If gold breaks below that level and starts using it as resistance, additional losses toward $1,790 (100-day SMA) and $1,780 (Fibonacci 61.8% retracement) could be witnessed.
Gold sentiment poll
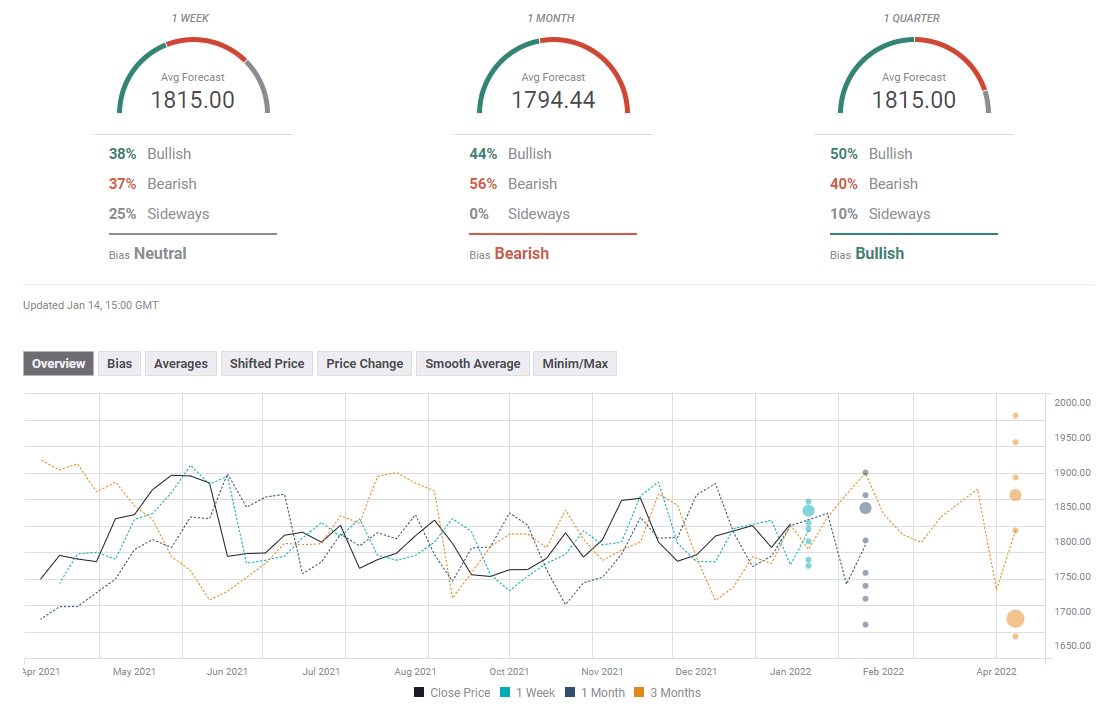
The FXStreet Forecast Poll shows that XAU/USD is likely to remain indecisive in the near term. The one-week average forecast stands at $1,815. The slight bearish bias stays intact as the average one-month target sits below $1,800.
Author

Eren Sengezer
FXStreet
As an economist at heart, Eren Sengezer specializes in the assessment of the short-term and long-term impacts of macroeconomic data, central bank policies and political developments on financial assets.

















