Gold stocks’ remain exceptionally weak even as stocks rise

Turning points ahead
So far, this week has been calm. However, as you read in my previous analysis, the turning points are near and All three of the assets where we have short positions have paused recently, and since it happened after a sizable move lower, it’s a completely natural phenomenon.
In the case of the FCX, it’s after a breakdown below the head and shoulders pattern, which means that the current tiny move us is perfectly in tune with the likely post-H&S pattern action, and it only confirms the very bearish outlook.
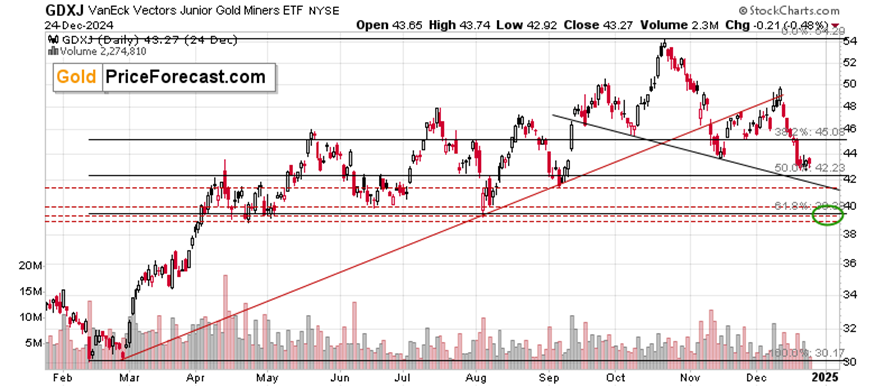
In the case of the GDXJ (and GDX), we see the back-forth movement is taking place below their November lows, which means that the breakdown below them was just verified.
In the case of the [new asset where we have a profitable short position], we have the same thing, with the additional note that it is much weaker as it fell well below its November lows and currently didn’t manage to move closer to them.
Also, please note that all the above is happening (or actually, not happening), while the general stock market moved higher recently.

This means that all the above-mentioned shares are NOT following stocks higher right after they DID follow them lower, magnifying their declines. This is a confirmation that we correctly chose the proxies to profit from the declines in in stocks and in the precious metals sector.
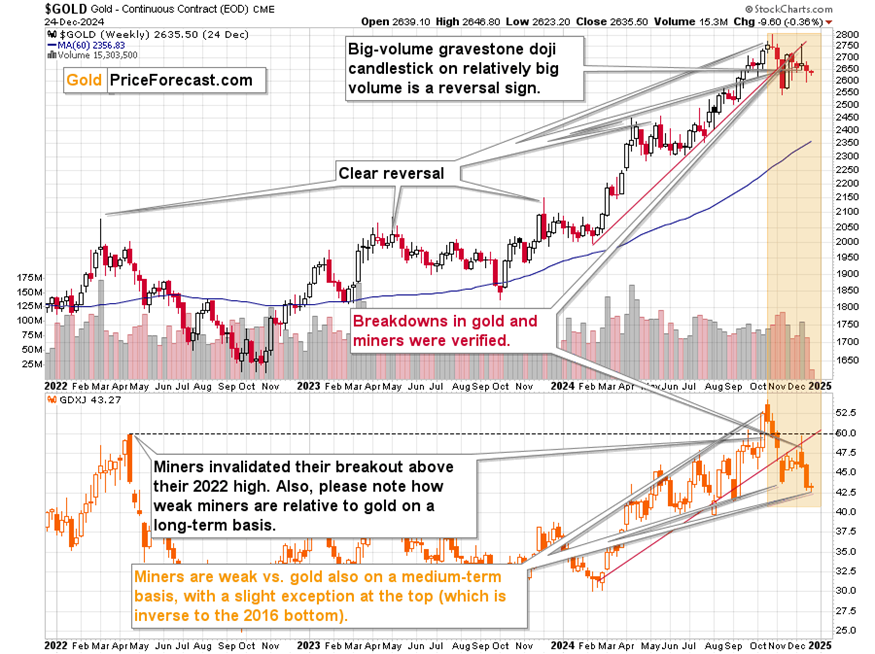
Having said that, I think it would be a good time to revisit the weekly chart (based on weekly candlesticks) featuring gold and GDXJ to put things into perspective. It’s just one chart, but it’s very rich in signs and clues.
Impending move lower
All right, where do we begin…
Let’s start with the breakdowns. Both: gold and GDXJ broke below their rising red support lines. It wouldn’t be as important as it is if it wasn’t for the verifications of those breakdowns. In both cases, we saw prices move back to the rising support lines, verifying them as resistance and then declining once again. This is a powerful indication that the trend changed and it’s now down.
Another clue is the general underperformance of mining stocks compared to gold. It’s obvious even at the first sight – while gold is hundreds of dollars above its 2022 high, miners just invalidated their move above it. On a short-term basis, we see that miners broke below their November lows, while gold didn’t do so (yet).
This is a sign suggesting that:
-
The entire precious metals sector is likely to move lower.
-
Miners are likely to move MUCH lower when gold declines.
This might also mean that some people might prefer a strategy where they own gold (and perhaps make passive income on it), but short mining stocks to hedge the above position (just my opinion, not investment advice).
One interesting thing is that miners moved up strongly relative to gold right at their top. This is a very specific exception from the rule that confirms it that is known to few. Namely, miners are weak before the trend changes, but right before that happens their volatility increases once again. We saw that at the 2016 bottom, where miners were first strong and held up well, but when they finally broke to new lows it was a bear trap.
What we saw at this year’s top was likely a bull trap.
The next thing is the way in which gold topped recently and at the yearly top. In both cases, it was a clear reversal. This meant tops multiple times in the past, and I marked that on the chart. Moreover, the most recent reversal took place on a relatively big volume, which confirmed the bearish outlook.
So yes, a bigger move lower is coming in the case of the precious metals market and GDXJ and [new asset where we have a short position] (and FCX, due to its own reasons) are poised to decline profoundly based on it. The first targets are as I’ve been outlining them, but it’s likely that all they will manage to do is to trigger a correction, not a new big rally.
Want free follow-ups to the above article and details not available to 99%+ investors? Sign up to our free newsletter today!
Want free follow-ups to the above article and details not available to 99%+ investors? Sign up to our free newsletter today!
Author

Przemyslaw Radomski, CFA
Gold Price Forecast
Przemyslaw Radomski, CFA (PR) is a precious metals investor and analyst who takes advantage of the emotionality on the markets, and invites you to do the same. His company, Sunshine Profits, publishes analytical software that any