Gold Stocks and the Sell Signal from the Inverse H&S Pattern

Wait, what?! Isn't the inverse head-and-shoulders a bullish pattern that was supposed to take gold miners much higher? Indeed, it is. But it didn't take gold miners much higher and all that the completion of the above-mentioned pattern generated was a corrective upswing that didn't even take gold stocks back above their December 2016 lows. And we warned that this is the likely outcome as the more important, long-term factors continued to favor lower mining stocks values. Why is there a sell signal based on the inverse H&S pattern? Because the breakout above its neck level was just invalidated and this invalidation by itself is a strong sell sign.
Let's take a closer look at the charts for details:
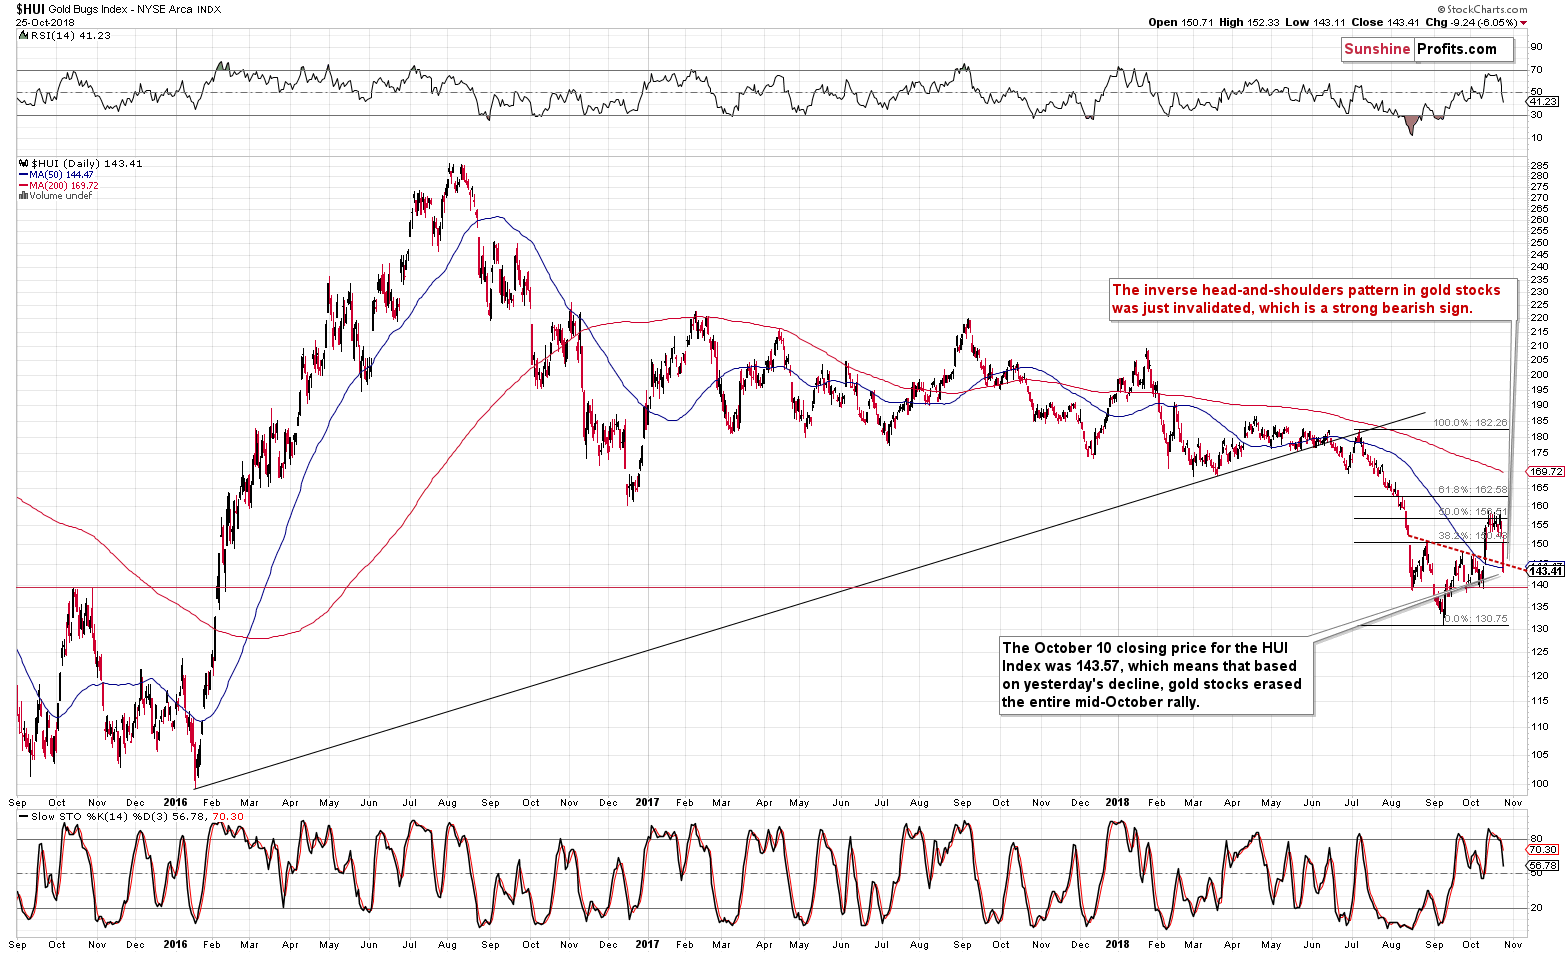
The HUI Index closed the day visibly below the neck level of the formation – we marked it with a red dashed line. But, at the same time, the gold miners index closed below the October 10th session. Why is this important? Because that was the last daily close before miners strongly rallied. This means that the entire mid-October rally is now more than erased.
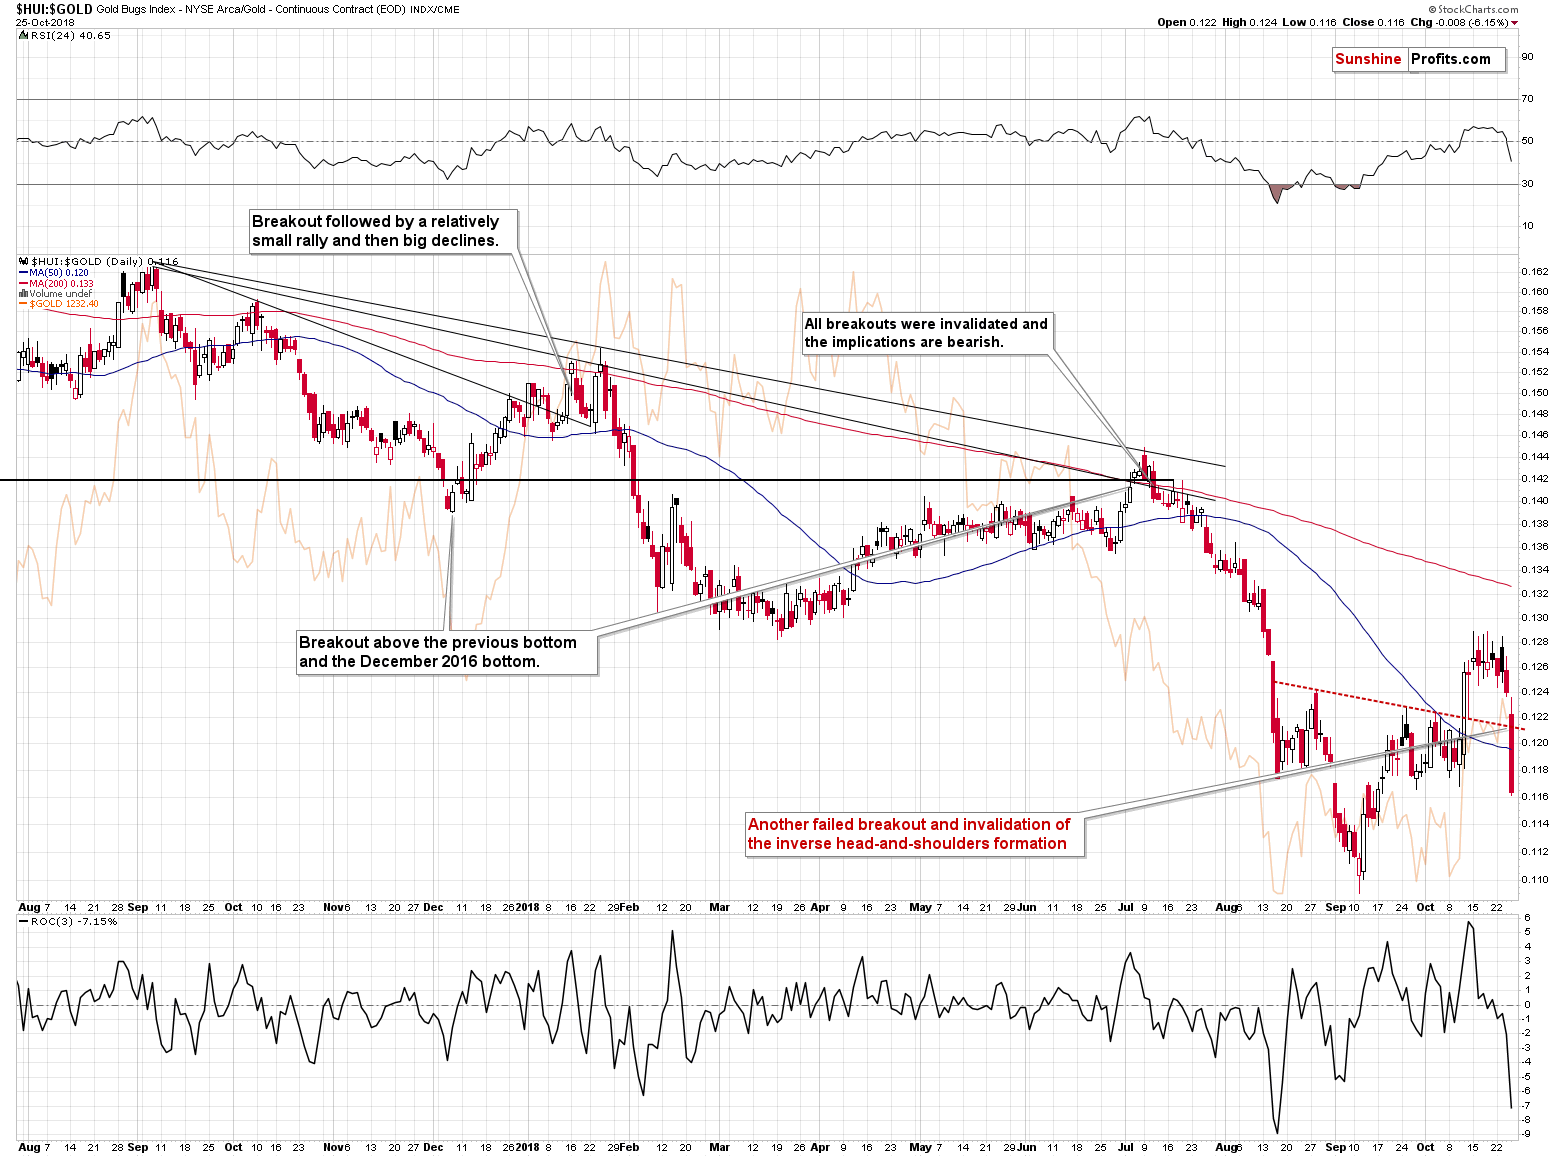
Comparing the value of the HUI Index to gold provides us with an even more bearish picture. The golds stocks to gold ratio closed well below the neck level of the inverse H&S formation and at the same time it closed below the both lows that created the "shoulders" thereof – the mid-August and late-September lows.
When gold stocks underperform gold to a considerable extent, it's a major sell signal. Yesterday, we saw them not only underperform in an extreme way, but also we saw an outstanding technical sign based on it – the invalidation of the inverse H&S pattern.
This is a very strong sign that the recent upswing was nothing more than just a correction within a bigger downtrend and that it's already over – at least in case of mining stocks.
Some may say that the decline is temporary and that it took place only because of the very bad earnings Q3 report from Goldcorp. We disagree. Please note that multiple mining stocks declined very significantly, it was not only Goldcorp. Besides, in case of many other companies (i.a. Barrick, and Newmont), the reported earnings beat analysts' expectations despite reporting losses. All in all, it seems that the decline really shows the weakness of the mining stocks and should be viewed as an important bearish sign.
Before moving on to the long-term implications of yesterday's decline, let's discuss the usefulness of relying on the inverse head-and-shoulders pattern despite multiple bearish signs.
The Long Inverse-H&S-based Trade in the Miners - Summary
The breakout took place on October 11th and the first HUI Index closing value after the breakout was 154.20. Waiting for the confirmation would have one go long at about 155, depending on what interpretation of "confirmation" one takes. The price moved back and forth, but it was trading at about 155, so using this level for this simulation seems justified. At that time gold promoters were cheering and many investors and traders "felt" that the bottom is in and that the rally has just begun. On a side note, be sure to pay extra attention to differentiating between the facts that can be verified objectively and "feelings" about the price or market – the latter are almost always deceptive. Or get assistance of someone who will focus on the facts on your behalf, saving you a lot of sleepless nights.
Now, after the breakout, we only saw back and forth trading – looking at the short-term perspective only would have one think that this is only a pause after the breakout and that higher prices are going to be seen shortly. It was not until yesterday that it became apparent that this formation was invalidated. Looking at the short-term only, the initial decline during yesterday's session didn't appear anything more than just a small correction within a rally. The realization only came once it was too late to exit the market – after the closing bell. Yesterday's closing price was 143.41. The loss on the hypothetical long position (the one that traders could realistically open based on the inverse head-and-shoulders formation) is now about 7.5% (in just 2 weeks).
The problem is that there are many gold investors and traders that will refuse to acknowledge that the inverse H&S formation does no longer provide any bullish implications and that we just saw a sell signal based on it. These are not feelings, but facts, and yet, many investors and traders will want to believe that the situation didn't change, and they will keep holding on to the losing long positions. Naturally, we respect such decisions as every investor can do with their savings what they want, but we strongly encourage all investors to always re-evaluate the current positions based on the facts that are available today, not in light of what made one originally open a given position. When the outlook changes, the position should change as well, even if it's a losing one. Why increase the losses instead of changing the position to the one that's likely to gain in light of the current outlook?
The invalidation of the short-term breakout above the neck of the inverse head-andshoulders formation is one thing, but the key signals come from the long-term charts.
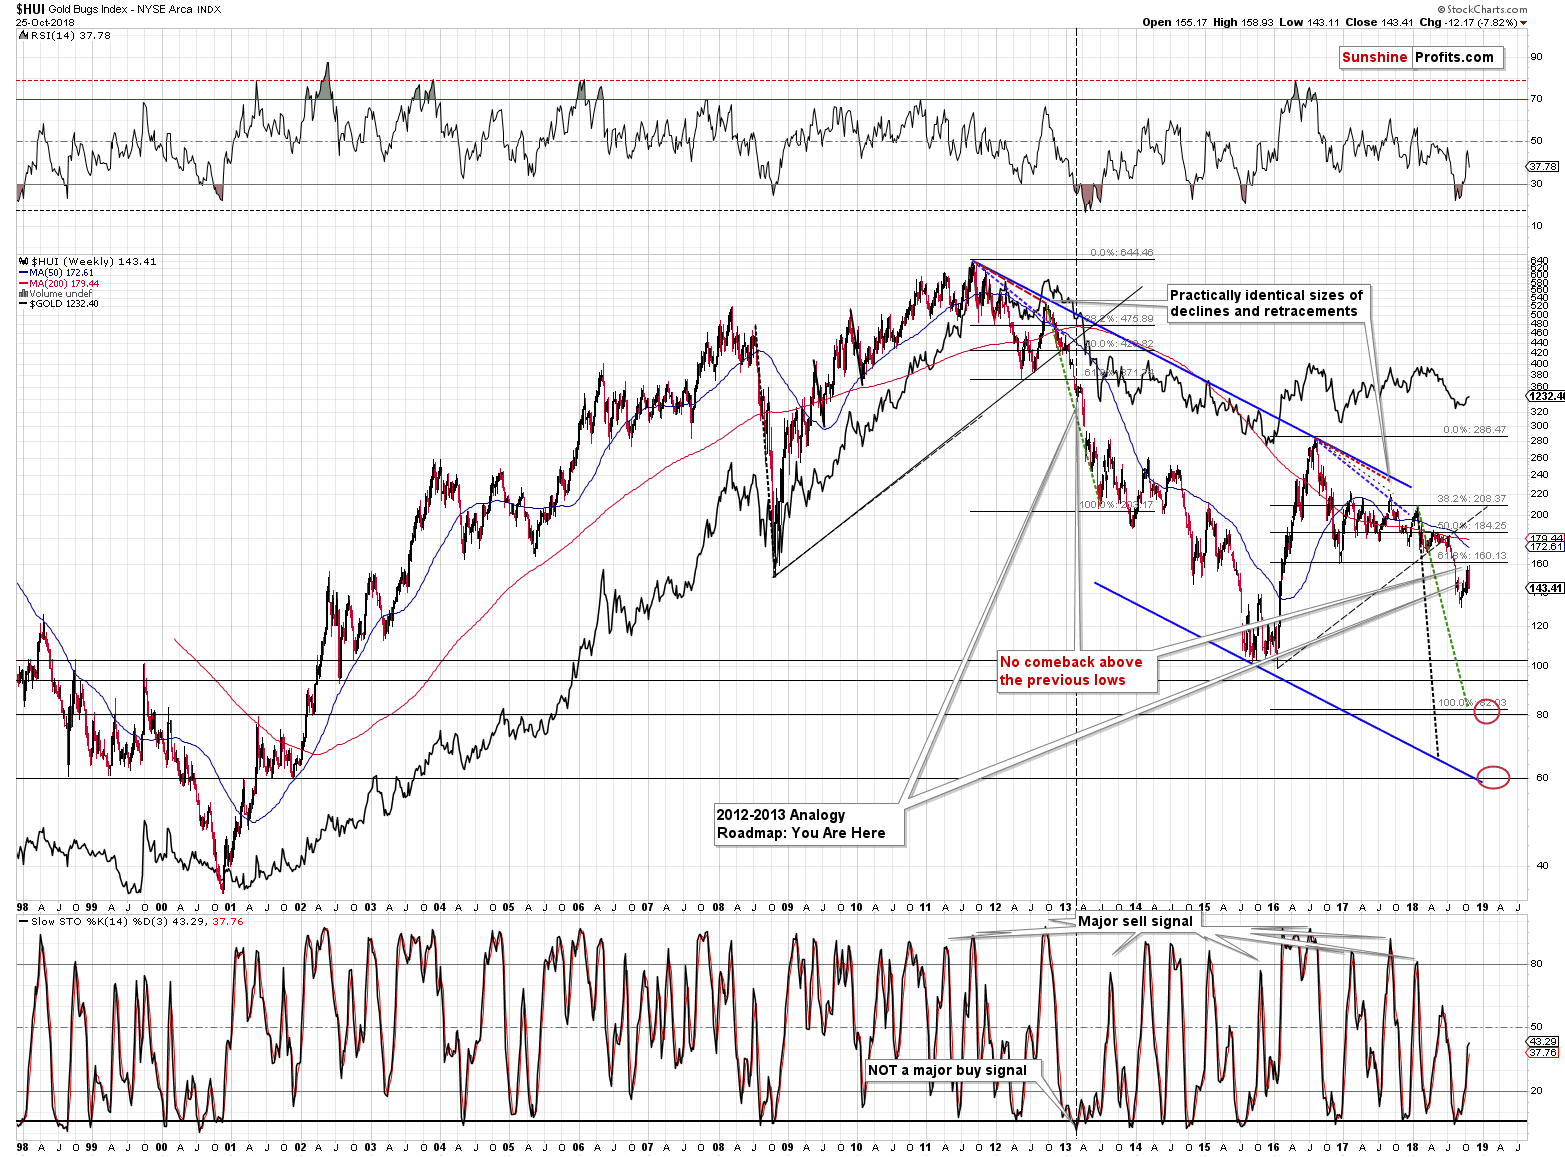
In our previous analyses, we emphasized that the current situation (including the shortterm upswing) remained similar to what happened in 2013 before the biggest part of the decline. In both cases, miners corrected, but failed to rally above the previously broken lows. In 2013, it was the 2012 low that was not broken, and this year, it was the December 2016 low. Yesterday's session and the strength of the decline makes is likely that the corrective upswing is over and that the corrective upswing is over without invalidation of the breakdown below the December 2016 low. In other words, both cases remain very similar and the outlook remains very bearish for the following weeks.
The additional bearish sign of critical importance comes from the USD Index.
The Critical USD Index Sign
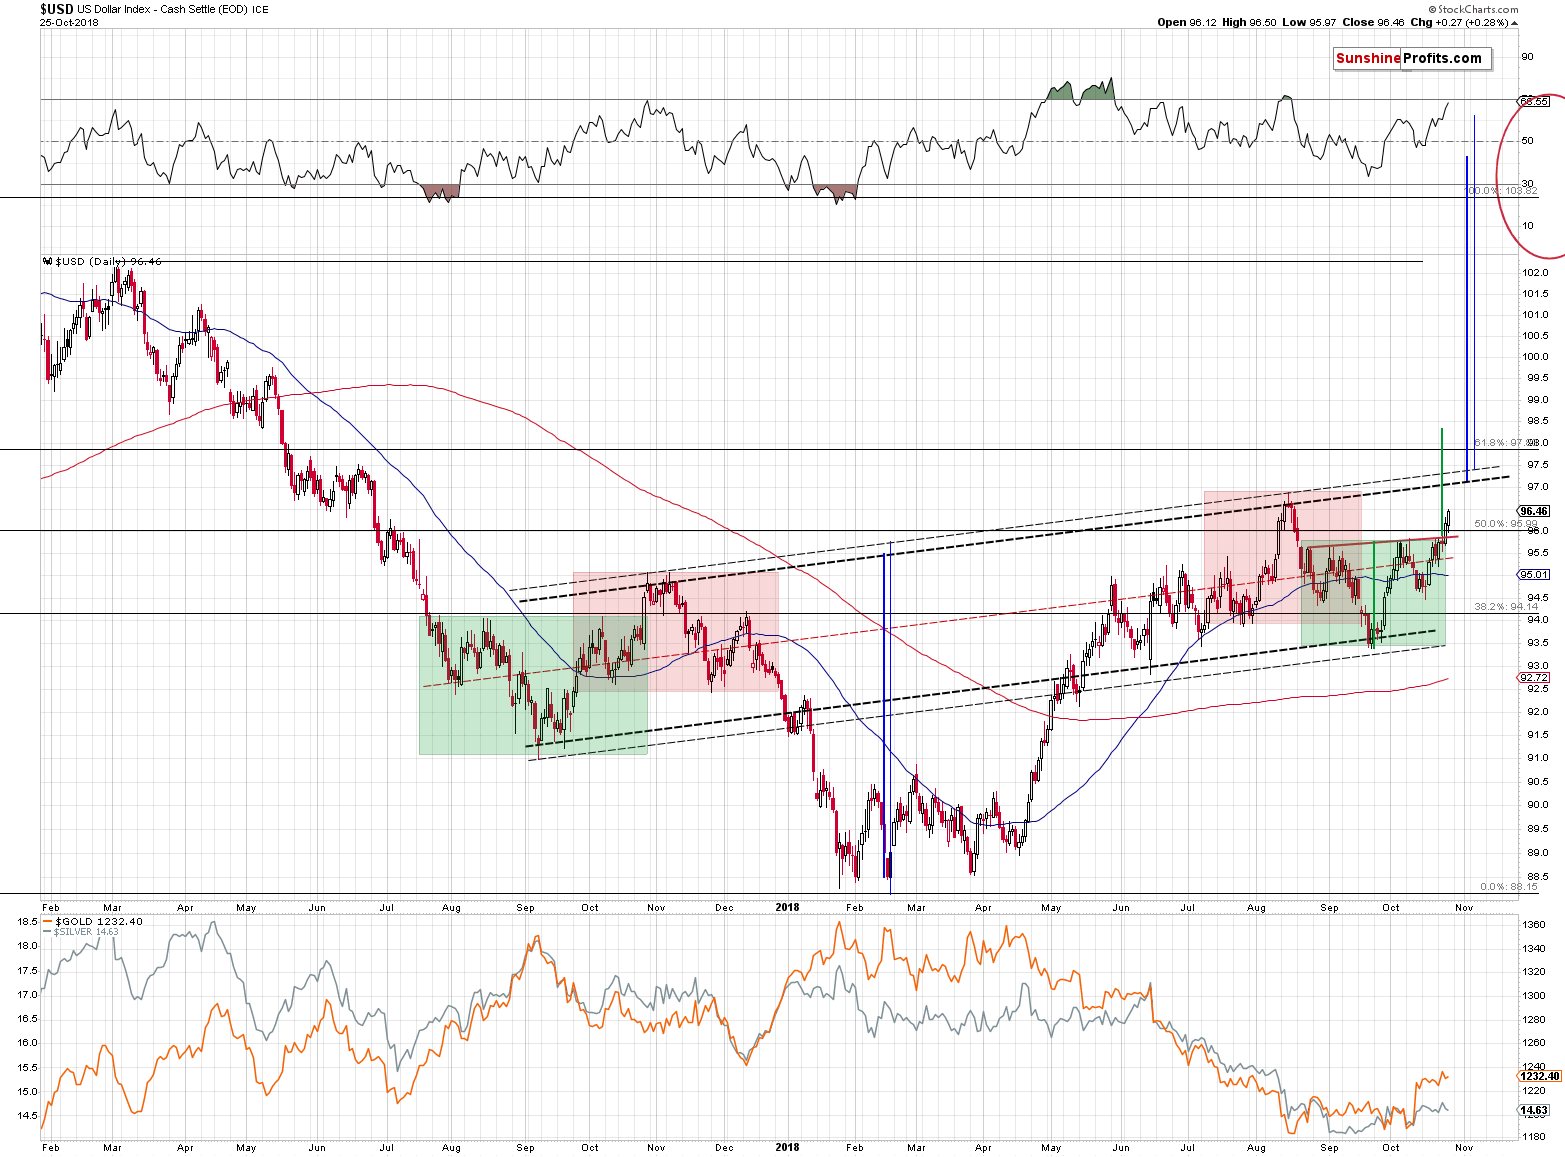
For two consecutive days, the USD Index closed the day visibly above the neck level of its inverse head-and-shoulders pattern. This is a critical development as it's the key step in breakout's verification. Ideally, we would like to see three consecutive closes, along with a weekly closing price above the neck level, in order to say that the breakout is truly confirmed. The week is ending today and at the moment of writing these words, the USD Index is trading above 96.80, so the odds are that we'll have this third (and weekly) close today.
The almost-fully-confirmed breakout in the USD Index is particularly bullish given the fact that it took place on very bearish news (Trump's criticism of the Fed's interest rate decisions).The USDX should have declined on it, and instead it moved to new shortterm highs. This is a very bullish combination for the US currency, and since the precious metals market generally moves in the opposite direction to the USD Index, the implications are very bearish for the PMs and mining stocks.
Summary
Summing up, yesterday's mining stocks' plunge confirmed the bearish outlook and the breakout in the USD Index and completion of the local inverse head-and-shoulders pattern suggests that the next big rally in the USDX has just started and that the opposite is very likely for the precious metals sector.
Want free follow-ups to the above article and details not available to 99%+ investors? Sign up to our free newsletter today!
Author

Paul Rejczak
Gold Price Forecast
Paul Rejczak is a stock market strategist who has been known for the quality of his technical and fundamental analysis since the late nineties.


