Gold slips from 4,210 as real-rate winds turn neutral
- Gold has slipped from 4,211 as the dollar steadies and U.S. yields hover near 4.1%–4.2%, muting the haven bid; the near-term tape is corrective with momentum aligned lower.
- Base case: extension toward 4,104 then 4,079 where a first bounce is likely; rallies are sellable into 4,145–4,170 unless price reclaims 4,170 on an hourly close, which would neutralize downside and reopen 4,186/4,211.
- Macro hinge remains U.S. real rates: softer Fed rhetoric or weaker energy/inflation would lower real yields and support a squeeze; stronger data or firmer issuance-driven term premia would cap gold below 4,170 and keep pressure on 4,079/4,038.

Market overview
Gold eased in European trade on Friday, giving back the late-week spike and slipping into a corrective slide toward the mid-$4,100s as the macro backdrop pivoted from “urgent haven” to “measured caution.” Two ingredients explain the air-pocket: a steadier dollar and a plateau in U.S. yields after their post-shutdown jitters. The greenback remains trapped in its multi-month range but is modestly firmer on the week, while 10-year Treasury yields hover a touch above the 4.1% area—levels that stop short of outright risk aversion and therefore blunt the bid for defensive assets. Reuters’ morning wrap framed exactly that mix: dollar index consolidating, U.S. 10-year around 4.12%, and markets oscillating between a softer growth pulse and still-restrictive policy signals.
For gold, that combination matters more than headlines, because bullion’s medium-term driver is the real yield—the inflation-adjusted policy anchor that discounts future cash flows. When nominal yields pause and inflation expectations are not accelerating, gold’s “carry disadvantage” is not widening, but nor is it narrowing. The result is a two-way, choppy tape: quick rallies as equities wobble or political noise flares, then intraday fades when the dollar stabilizes and risk appetite returns.
Second-order currents also lean neutral to slightly negative for bullion into the U.S. close. A tentative improvement in risk appetite after the Senate’s movement toward interim government funding has reduced the most extreme tail-risk hedging. That took some of the emergency shine off havens and helped cap the week’s earlier gold pop. Meanwhile, oil’s mid-week rebound stalled after a larger-than-expected U.S. crude stock build and a heavy 30-year auction that reminded investors that supply, liquidity and issuance dynamics still matter for rates and risk—again, the kind of environment that cools rather than ignites gold’s impulse.
More broadly, bullion is stuck between long-running, bullish structural demand (central-bank diversification, geopolitics, and multi-polar reserve hedging) and a cyclical ceiling governed by real rates and the dollar. Earlier this year, gold’s parabolic surge and subsequent consolidation left a wide technical airspace overhead but also a crowded long community that now trims on strength. Reuters’ recent “Take Five” and “Morning News” updates describe this market phase well: macro data are trickling out as the shutdown backlog clears, positioning is sensitive, and the dollar-rates complex continues to set the hour-to-hour tone for cross-asset risk.
Technical analysis
Current technical conditions and main scenario
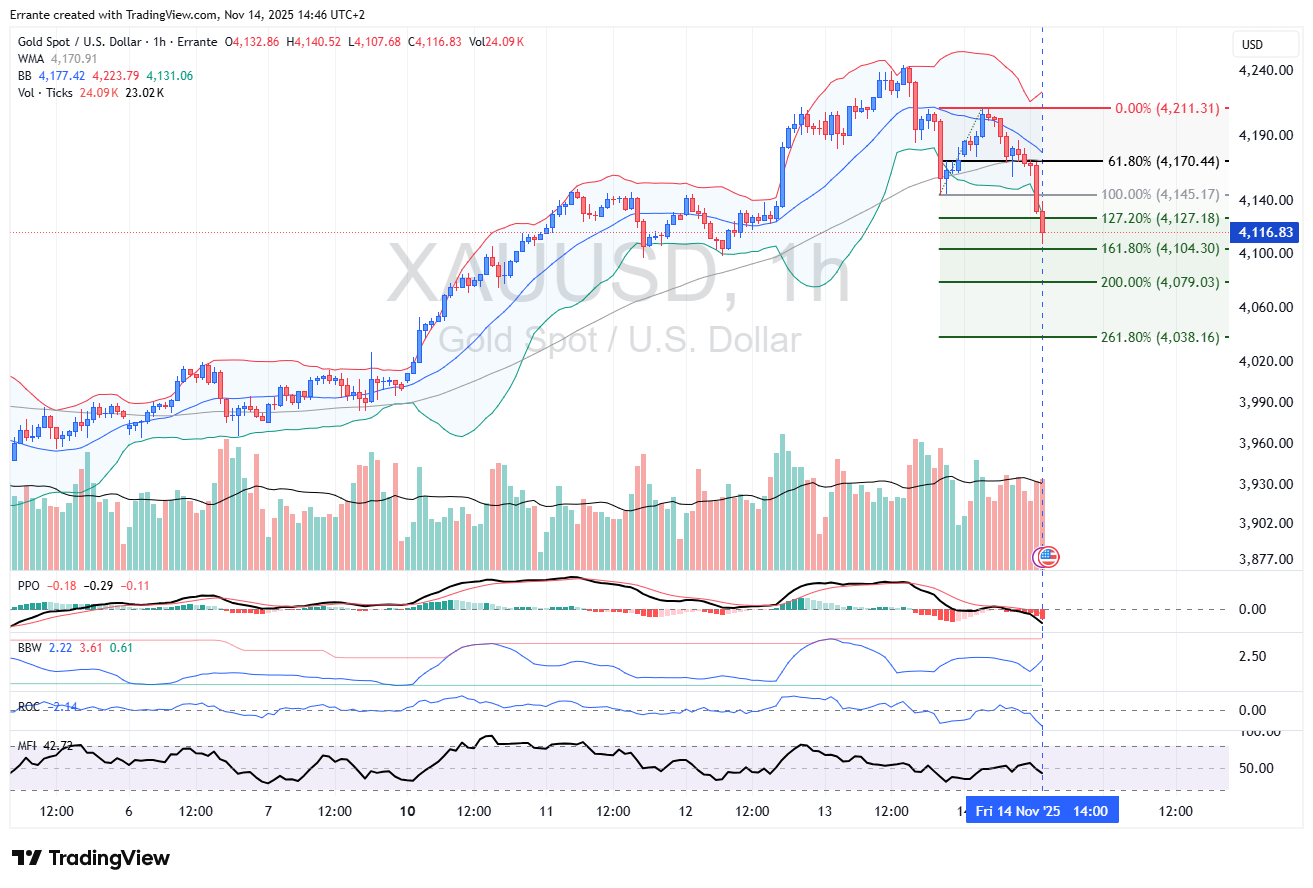
The one-hour chart shows gold reversing from 4,211 (intraday swing high) and breaking down through a narrow consolidation shelf at 4,145–4,150. Price now trades around 4,116, below the 20-period basis line of the Bollinger Bands and beneath the hourly weighted moving average near 4,171. The break turned the prior shelf into an overhead supply zone and opened a measured move toward the Fibonacci expansion cluster that sits in the 4,104–4,079 corridor.
Breadth within the move points to continuation lower before any durable basing attempt:
- The selloff accelerated on expanding range with a visible uptick in volume bars during down candles—classic distribution on the lower time frame.
- Bollinger bandwidth is widening from a low base, a hallmark of a fresh volatility expansion after compression. When bandwidth expands while price rides the lower band, follow-through tends to persist until a band “walk” exhausts into a hammer or positive divergence; we don’t have that yet.
- The intraday structure has rotated from higher-lows to lower-highs since the 4,211 peak. The latest rebound attempts stalled below 4,170 and again under 4,150, confirming that supply now sits above market.
Base case (60–65% probability): the down-leg extends into 4,104 (161.8% projection of the 4,211→4,145 drop measured from the 4,170 retest). If momentum holds, the move can overshoot into 4,079 (200% extension) where we also meet a micro confluence with the lower Bollinger band on the one-hour and a prior demand pocket visible on the 30-minute tape. A “reactionary” bounce from 4,104/4,079 back toward 4,145/4,150 is likely on the first touch, but unless price reclaims and closes above 4,170, rallies are sells into supply.
Oscillators and momentum profile
- PPO/MACD histogram is negative and below its signal line, with the fast line curling down from the zero axis. That tells us the latest rally into 4,170 was corrective and that downside momentum is re-energizing rather than exhausting.
- ROC has slipped below zero and remains below its own short average. In trend-following terms, that keeps momentum bearish on the intraday horizon and argues for continuation until a positive ROC divergence appears against price—none yet.
- MFI sits in the low-40s and is trending lower. Money Flow slipping while price presses the lower band indicates selling pressure on balance; it is not yet oversold, leaving room to 30–35 before dip-buyers gain tactical leverage.
- Bollinger bandwidth jumped from near 2.0 to above 3.0 as price tagged the lower band; early in a bandwidth surge, the path of least resistance typically remains in the direction of the break.
Net read: momentum favors a push into the 4,104/4,079 zone before conditions ripen for a counter-trend bounce.
Key levels
Support
- 4,127/4,128: 127.2% Fibonacci expansion of the 4,211→4,145 leg; minor waystation where sellers can reload.
- 4,104/4,105: 161.8% expansion and lower-time-frame demand shelf; first meaningful bounce candidate.
- 4,079/4,080: 200% expansion and round-number psychology; if taken cleanly on a closing basis, opens the door to 4,038.
- 4,038/4,040: 261.8% expansion; “exhaustion zone” for this swing where momentum should begin to diverge if the trend is merely corrective.
Resistance
- 4,145–4,150: broken floor turned ceiling; first layer of supply and a pivot for day-traders.
- 4,170/4,171: hourly WMA and 61.8% retracement of the last impulse lower; a decisive close above would neutralize the immediate downside impulse.
- 4,186–4,192: upper half of the prior distribution; sellers likely defend here unless macro news flips the rates/dollar backdrop.
- 4,211/4,212: local high; a closing break would invalidate the current downswing and re-open 4,230–4,250.
Alternative scenario (lower probability)
Should gold reclaim 4,170 on a sustained hourly close and hold that level as support, bears would lose the initiative. In that case, the market would be signaling that the drop into 4,116–4,128 was a bear trap within a still-intact medium-term uptrend. A squeeze could then extend back to 4,186/4,192 and, if momentum turns positive, to 4,211/4,230. The trigger for that scenario would likely be a fresh leg lower in U.S. yields or a sharp dollar slip—both of which would compress real rates and immediately improve bullion’s carry-adjusted appeal.
Fundamental outlook and macro mechanics
The near-term calendar and why it matters for Gold
Two macro levers dominate gold’s tactical P&L: the U.S. dollar and the U.S. real-rate curve. The upcoming docket skews exactly to those levers.
1. Fed speak and curves. Multiple FOMC officials are on the tape into the U.S. close and early next week. Markets are treating the December meeting as a live debate in a data-fogged environment. If speakers lean more heavily into “proceed carefully” and stress two-sided risks, the long end of the Treasury curve can stabilize or dip, easing real yields and aiding gold. If, however, they revive “higher for longer” rhetoric in response to sticky services inflation, the curve could re-steepen bearishly, supporting the dollar and leaning against bullion. Reuters’ morning note underscored this balancing act: the dollar has firmed marginally on the week, while yields linger near 4.1–4.2%, keeping risk assets and gold in check.
2. Energy balance sheets. OPEC and IEA monthly assessments, alongside U.S. inventory data, feed inflation expectations through the oil channel. The mid-week EIA Short-Term Energy Outlook and the heavy U.S. crude inventory build injected a mild disinflationary flavor into the rates complex—another reason the week’s gold rally fizzled as breakevens softened. If next reports reinforce ample supply and moderating demand, breakevens can cool further, lifting real yields at the margin and capping bullion.
3. The shutdown story. Progress toward interim funding has already soothed the most acute “tail-risk” hedging demand. If final votes materialize promptly, that removes a key anxiety premium from haven assets. Conversely, any renewed brinkmanship or procedural surprise can re-ignite tactical demand for gold.
Cross-currents beyond the US
China’s late-week activity run was a headwind for the commodity complex. Industrial production and retail sales disappointed relative to consensus while credit aggregates undershot, reinforcing a stop-start recovery narrative. For bullion, the China channel cuts both ways: softer growth saps jewelry demand and dents broad commodity beta, but it also keeps global disinflation pressures alive—bolstering the case for easier policy down the line. In the near term, the demand impulse dominates and argues against a clean breakout in gold absent a U.S. rates tailwind.
In Europe, Q3 GDP and forward-looking surveys paint a picture of slow growth with disinflation traction. That mix can weaken the euro on the margins and prop up the trade-weighted dollar, which is neutral-to-negative for bullion’s dollar-price. Meanwhile, for the yen block, improving BoJ rhetoric about normalization absorbs some safe-haven flows that otherwise might migrate to gold. None of these are first-order drivers this week; they modulate the dollar’s path and the global risk premium—the conduits that ultimately matter for XAU.
Medium-term analogy: How economic trends filter into Gold
Think of bullion’s medium-term value as the equilibrium of three gears that spin at different speeds.
Gear 1 (fast): real rates and the dollar. These drive day-to-day conviction. A 10–20bp move in U.S. real yields can overwhelm almost any other input. If the 10-year TIPS yield rolls over decisively, the “opportunity cost” of holding a non-yielding asset falls—bullion levitates. If real yields firm, gold pulls back, often regardless of geopolitical noise.
Gear 2 (intermediate): risk appetite and issuance/liquidity. The supply of safe assets (Treasury issuance, term premium), the health of equity risk premia, and cross-border funding costs determine how much demand there is for convex hedges and duration substitutes like gold. In 2023–2024, surging issuance and fragile liquidity created a supportive backdrop; in 2025, as issuance was absorbed and term premia stabilized, the “fear bid” in gold cooled, though not uniformly across episodes.
Gear 3 (slow): structural demand. Central banks’ desire to diversify reserves, dedollarization debates, and retail adoption (ETFs, bar/coin) set the floor. Reuters has documented that the super-cycle in central-bank purchases and episodic surges in investor flows were key planks of gold’s multi-year uptrend; those flows wax and wane, but the regime is intact. In practice, Gear 3 prevents deep, lasting drawdowns unless real rates tighten meaningfully.
Where are we now on this three-gear dashboard? Gear 1 is neutral-to-slightly restrictive (real yields steady to firmer). Gear 2 is mixed: equity volatility has been two-sided and issuance is still heavy enough to keep a floor under term premia, but not distressing. Gear 3 is supportive but not accelerating. That triad argues for a broad trading range in gold with mean-reverting tendencies unless macro data sharply reprice the Fed path.
Strategy implications and positioning logic
Given that backdrop, the trading logic for the next several sessions is straightforward:
- Fade strength into 4,150–4,170 unless two conditions flip: a visible downtick in U.S. real yields and a clean, impulsive reclaim of 4,170 on rising breadth. Without both, rallies are counter-trend in the intraday regime and likely to stall under 4,192/4,211.
- Respect the 4,104/4,079 support zone as the first place shorts harvest. This is where the Fibonacci cluster, lower-band dynamics, and short-term exhaustion often intersect. On first test, programs will cover; if momentum is still negative without positive divergence, a second push can probe 4,038.
- Keep a mental model of “macro triggers.” The fast trigger is a yield move: a 10–12bp drop in the U.S. 10-year alongside a modest dollar fade is usually worth $30–$40 in gold in a single session. The slow trigger is a renewed geopolitical risk premium or a policy surprise that pushes markets to hedge tail risk; that converts dips into higher-quality entries but is impossible to time, so sizing and risk discipline matter more than prediction.
- Translate calendar risk into levels. Fed speak that softens the path of real yields is the catalyst needed to flip the alternative scenario. Conversely, hawkish-leaning remarks that lift the long end or a stronger-than-expected U.S. activity impulse would harden resistance at 4,170 and make a test of 4,079/4,038 more likely.
Putting it all together
Gold’s slip from 4,211 is less about a regime change and more about a reversion to the mean as the emergency bid fades and the rates/dollar complex returns to the driver’s seat. The tape says supply now dominates between 4,145 and 4,170; momentum indicators endorse a continuation lower toward 4,104 then 4,079, where the market should attempt its first proper bounce. That is your near-term “map.”
Beyond the next few sessions, the thesis reduces to real yields. If U.S. breakevens cool further while nominal yields hold, real rates will nudge higher and cap bullion toward 4,170/4,210. If instead macro communication or softer energy/inflation prints pull the real curve down, gold will try again to reclaim the 4,200s and rebuild a base for a medium-term push. Structural buyers—the slow gear—remain a backstop on deep dips, but the marginal price is set by the fast gear, and that gear for now is running at neutral.
Tactical bias: Bearish within the day toward 4,104/4,079; neutral-bearish on a 2–4 day horizon unless price reclaims 4,170 on closing basis with falling real yields.
Risk management notes: Watch one-hour PPO and ROC for a positive divergence as price approaches 4,079/4,038; that signal, combined with a volatility contraction (bandwidth rolling over), would mark the highest-probability counter-trend long. On the topside, a clean hourly close above 4,170 with breadth expansion (green volume bars and PPO cross) shifts bias to range-neutral and opens 4,186/4,211.
In markets where the narrative changes faster than the facts, method beats mythology: map the levels, marry them to the calendar, and let the real-rate cursor tell you when to press or stand down. The rest is noise, and gold has always been a connoisseur of separating signal from story.
Author

Ali Mortazavi
Errante
BEc, CMSA, Member of IFTA - International Federation of Technical Analysis, Associate Member of STA - Society of Technical Analysis (UK).


