Gold rallies on geopolitical jitters and tariff uncertainty
- Fed independence concerns persist as diversification gains attention.
- Gold and silver hit record highs amid geopolitical tensions.
- Copper climbs to its highest level on record.
- Bank Stocks Sink Despite Upbeat Results.
- Oil climbs on Iran supply disruption fears.
- Policy uncertainty fuels ‘Sell America’ headlines.
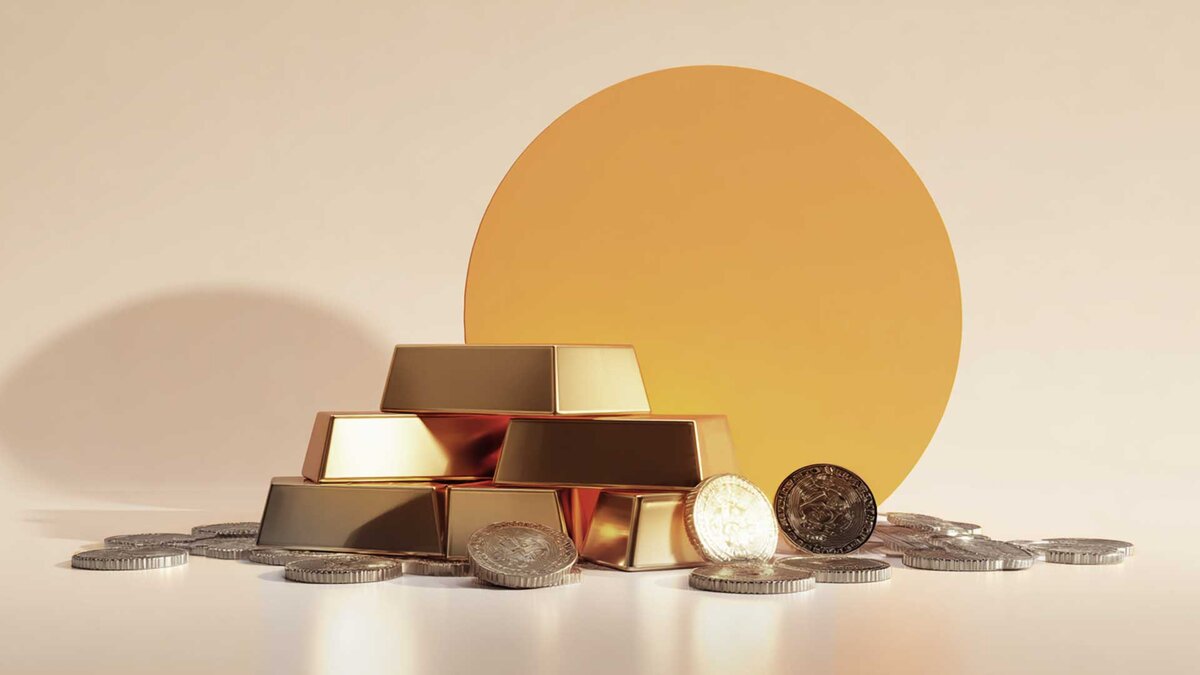
Global metals surged Wednesday, with gold, silver, and copper setting new records on geopolitical risk, currency debasement, and robust industrial demand.
Spot gold rose 1.15% to $4,639.61 per ounce, as of 1939 GMT. Silver recorded an all-time high at 92.995 per ounce and was trading 92.49 at 1941 GMT.
Gold, a non-yielding asset, tends to outperform in low-rate, high-uncertainty environments, and safe-haven demand has risen amid heightened geopolitical tensions.
Iran’s intensifying protests reportedly causing around 2,000 deaths have stoked fears of broader Middle East instability.
President Trump warned of potential military action and floated a 25% tariff on countries doing business with Iran, urging protesters to escalate pressure, and signaling “help is on its way.”
Gold also drew support from fears over Fed independence after the Trump administration opened a criminal probe involving Chair Jerome Powell—an unsettling move for markets—even as central bank leaders and major bank executives publicly backed Powell and underscored the need to safeguard the Fed’s autonomy.
CME FedWatch:
Current Target Rate = 3.50 - 3.75

· CME FedWatch January no rate change probabilities have moved higher to 95% today from 75.6% on December 12, 2025.
Technical analysis perspective:
Gold / US Dollar:
· Spot gold must clear $4,642–$4,645 to unlock upside momentum.
· A rejection there favors a pullback to $4,610–$4,607 before another push higher.
· Gold is up about 7.3% year-to-date.
· Price action remains classically bullish: higher highs, brief corrections, then fresh records.
Gold hourly chart:

Gold/Silver Ratio:
· The gold–silver ratio measures how many ounces of silver are needed to buy one ounce of gold (gold price ÷ silver price), a key gauge of relative value and potential moves.
· It is near 50, the lowest since March 2012.
Gold/Silver Ratio Monthly chart:

GLD (SPDR Gold Trust) ETF:
· GLD is testing the top of its rising channel at 428–429.
· A breakout above 429 would add upside momentum.
· Failure to break likely sees a pullback toward 417.
GLD daily chart:

GLD Seasonality:

Since 2007, GLD has risen an average of 3.3% in January 70% of the time, and 1.00% in February 58% of the time.
Author

Ali Merchant, CMT
TwT Learning
Ali Merchant is a seasoned financial market professional with expertise in Technical Analysis, Treasury & Capital Markets, Trading, Sales, Research, Training, & Fund Management, He has been trading FX, FX options, US stock


