Gold prices surge as safe-haven demand rises amid trade tensions

Risk aversion continues to fuel gold demand, with the yellow metal crossing the $2,900 threshold on Monday. The rally was driven by US President Donald Trump’s announcement of new tariffs on steel and aluminum imports. Trump confirmed a 25% tariff on these commodities and hinted at reciprocal tariffs on countries that impose levies on US goods and services. Despite positive sentiment in equities, demand for gold remains strong as investors seek safety amid economic uncertainty.
Gold rallies as market awaits Fed testimony and inflation data
Gold extended its rally to $2,940 on Tuesday, maintaining strong momentum. The US Dollar remains firm, yet investors continue to favor safe-haven assets like gold and the Japanese Yen. Wall Street is holding on to modest gains, but caution prevails as markets await further statements from President Trump and economic data releases.
The focus this week remains on the US, with Federal Reserve Chairman Jerome Powell set to testify before Congress on Tuesday and Wednesday. Investors will look for clues on future interest rate decisions, which could impact gold’s trajectory. Additionally, the US Consumer Price Index (CPI) for January is due on Wednesday, with expectations of a core annual inflation rate of 3.1%, slightly lower than December’s 3.2%. Lower inflation could increase speculation of rate cuts, supporting further gold upside.
Gold Technical Analysis: Trading strategy amid trade tensions
Gold is trading within a well-defined ascending channel, as shown in the attached chart. The price has now reached the upper boundary of this channel, testing resistance in the $2,900–$3,000 zone. A breakout above this level could extend its rally further, making new highs.
Traders should watch for confirmation before entering new positions. A strong daily close above $2,950 could confirm a bullish breakout, while failure to hold above this level may trigger a pullback. If gold retraces, key support levels to watch include $2,750 (mid-channel) and $2,600 (lower boundary of the channel). A break below $2,600 would signal a potential trend reversal.
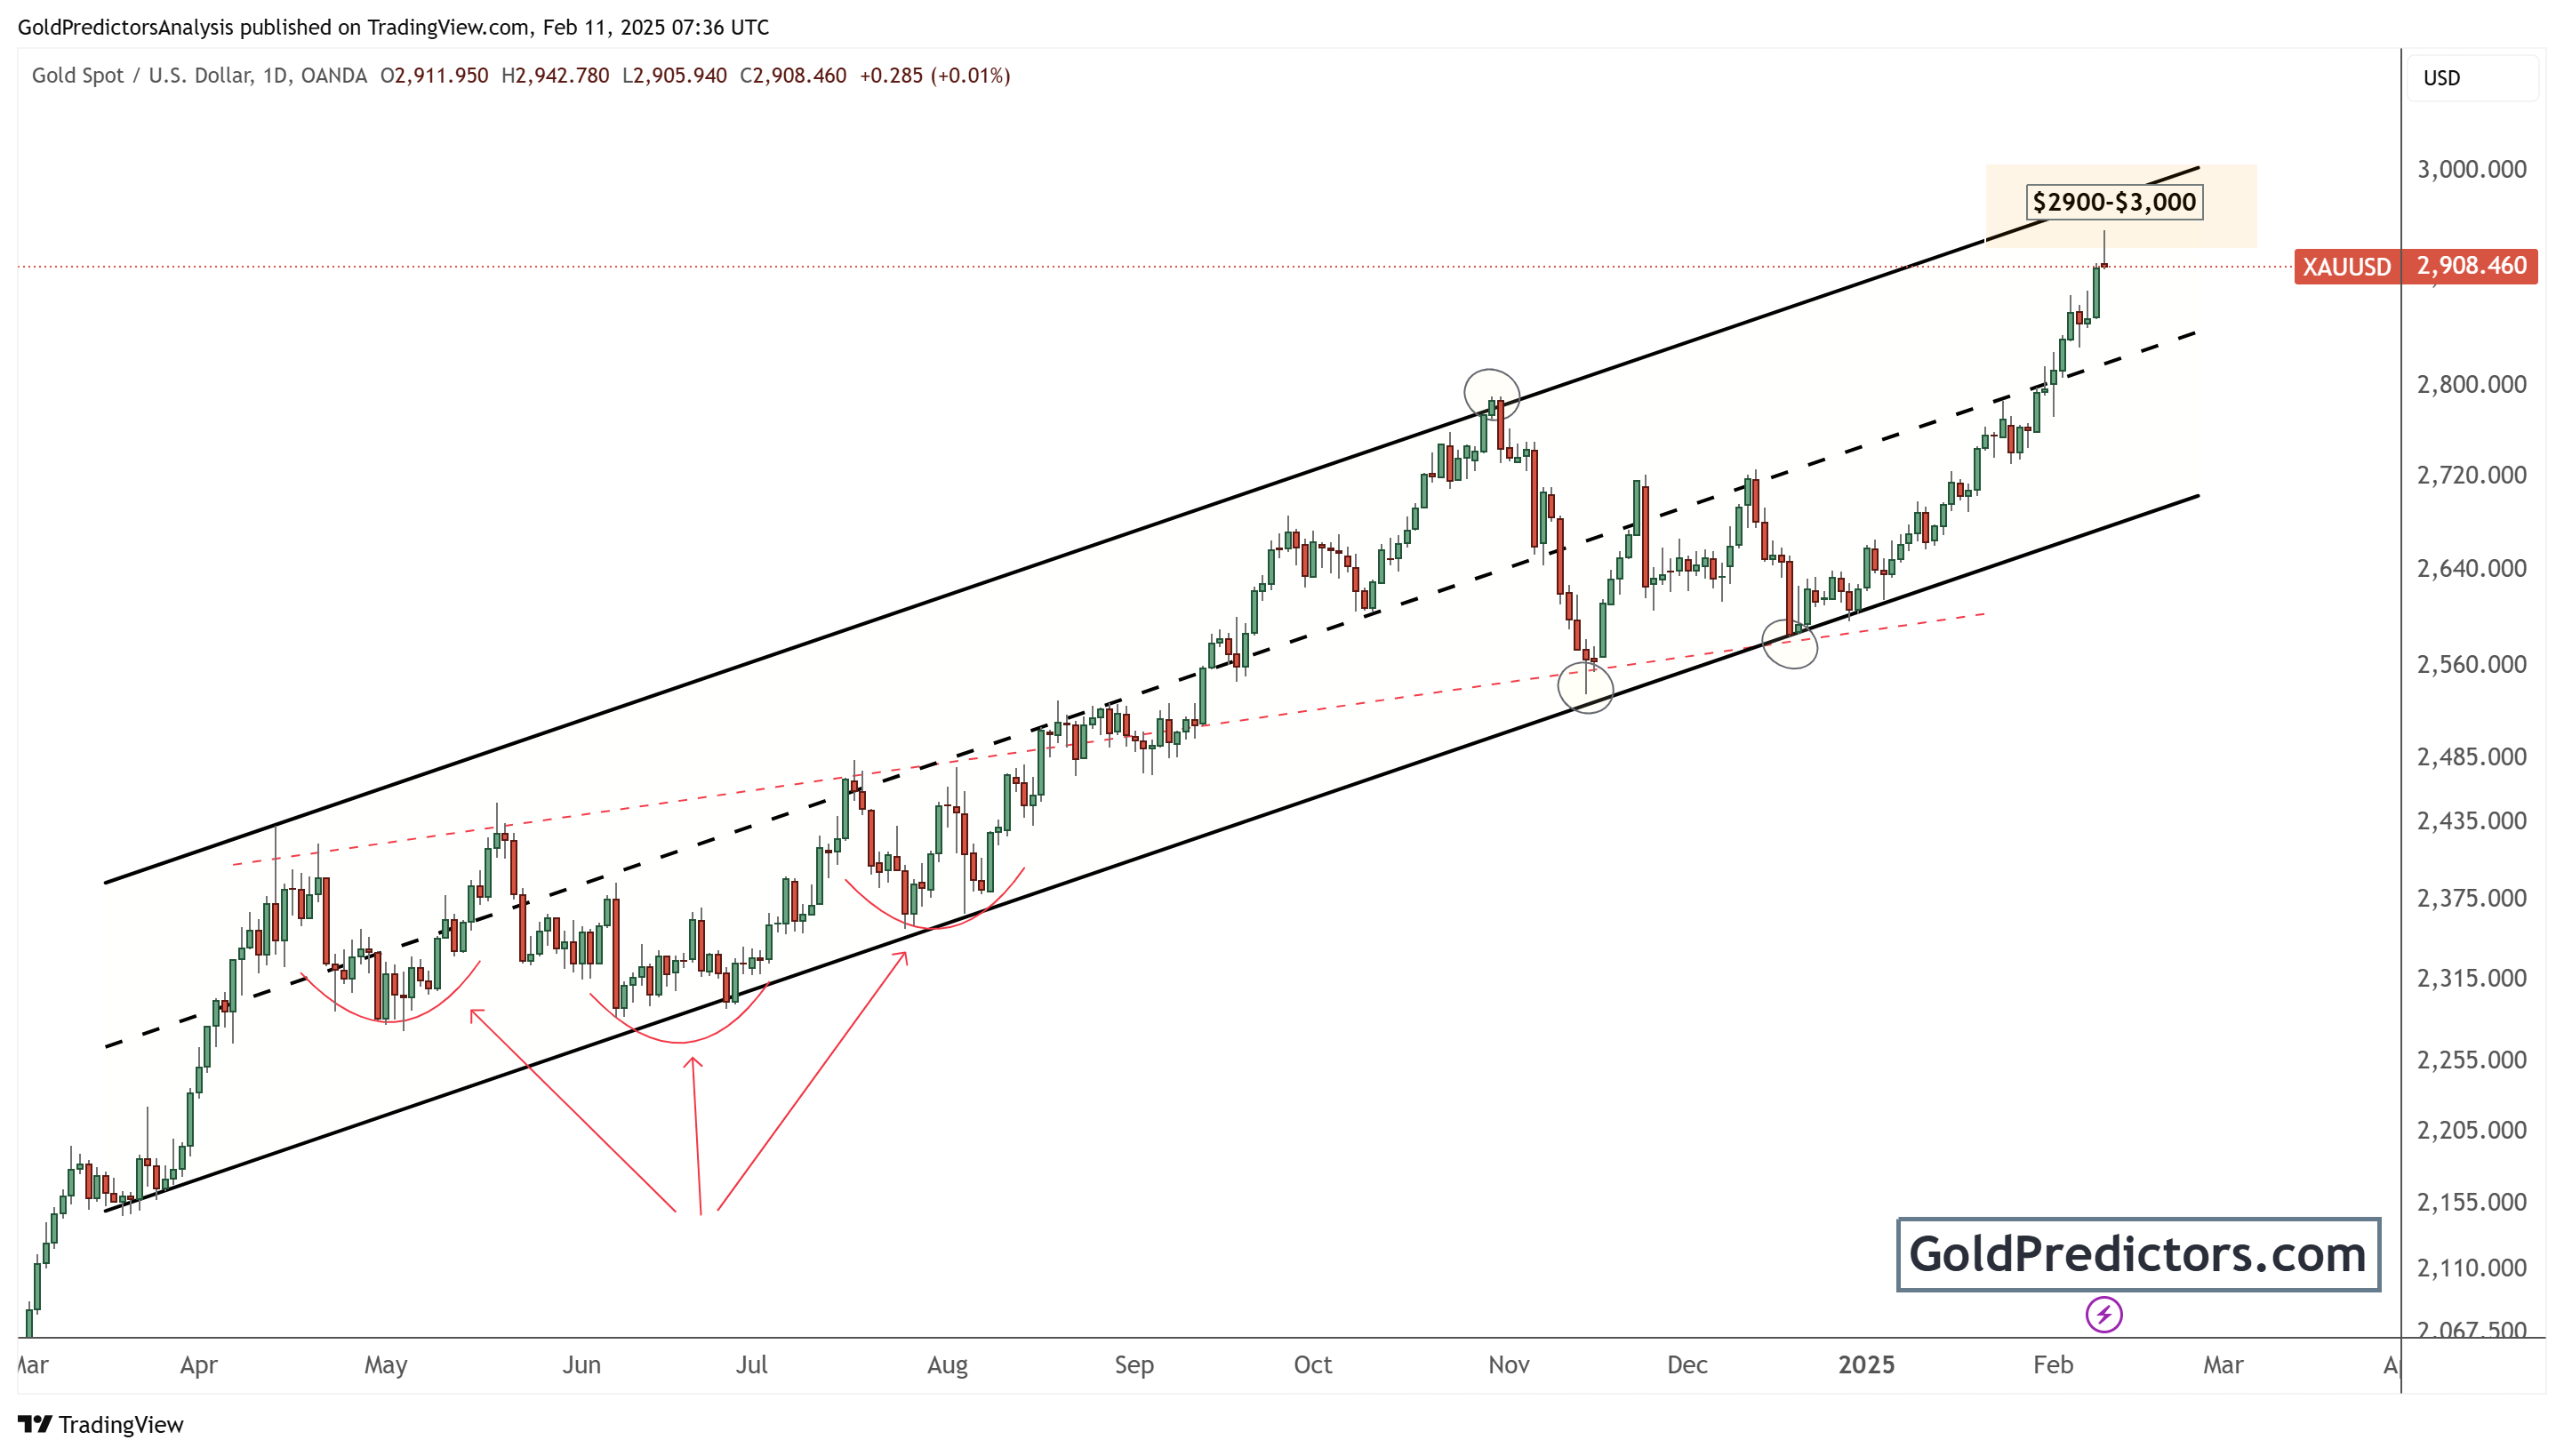
To manage risk effectively, traders should use stop-loss orders below recent lows and track fundamental catalysts such as Powell’s testimony and US inflation data. Increased volatility in response to these events could create strong price swings, offering trading opportunities.
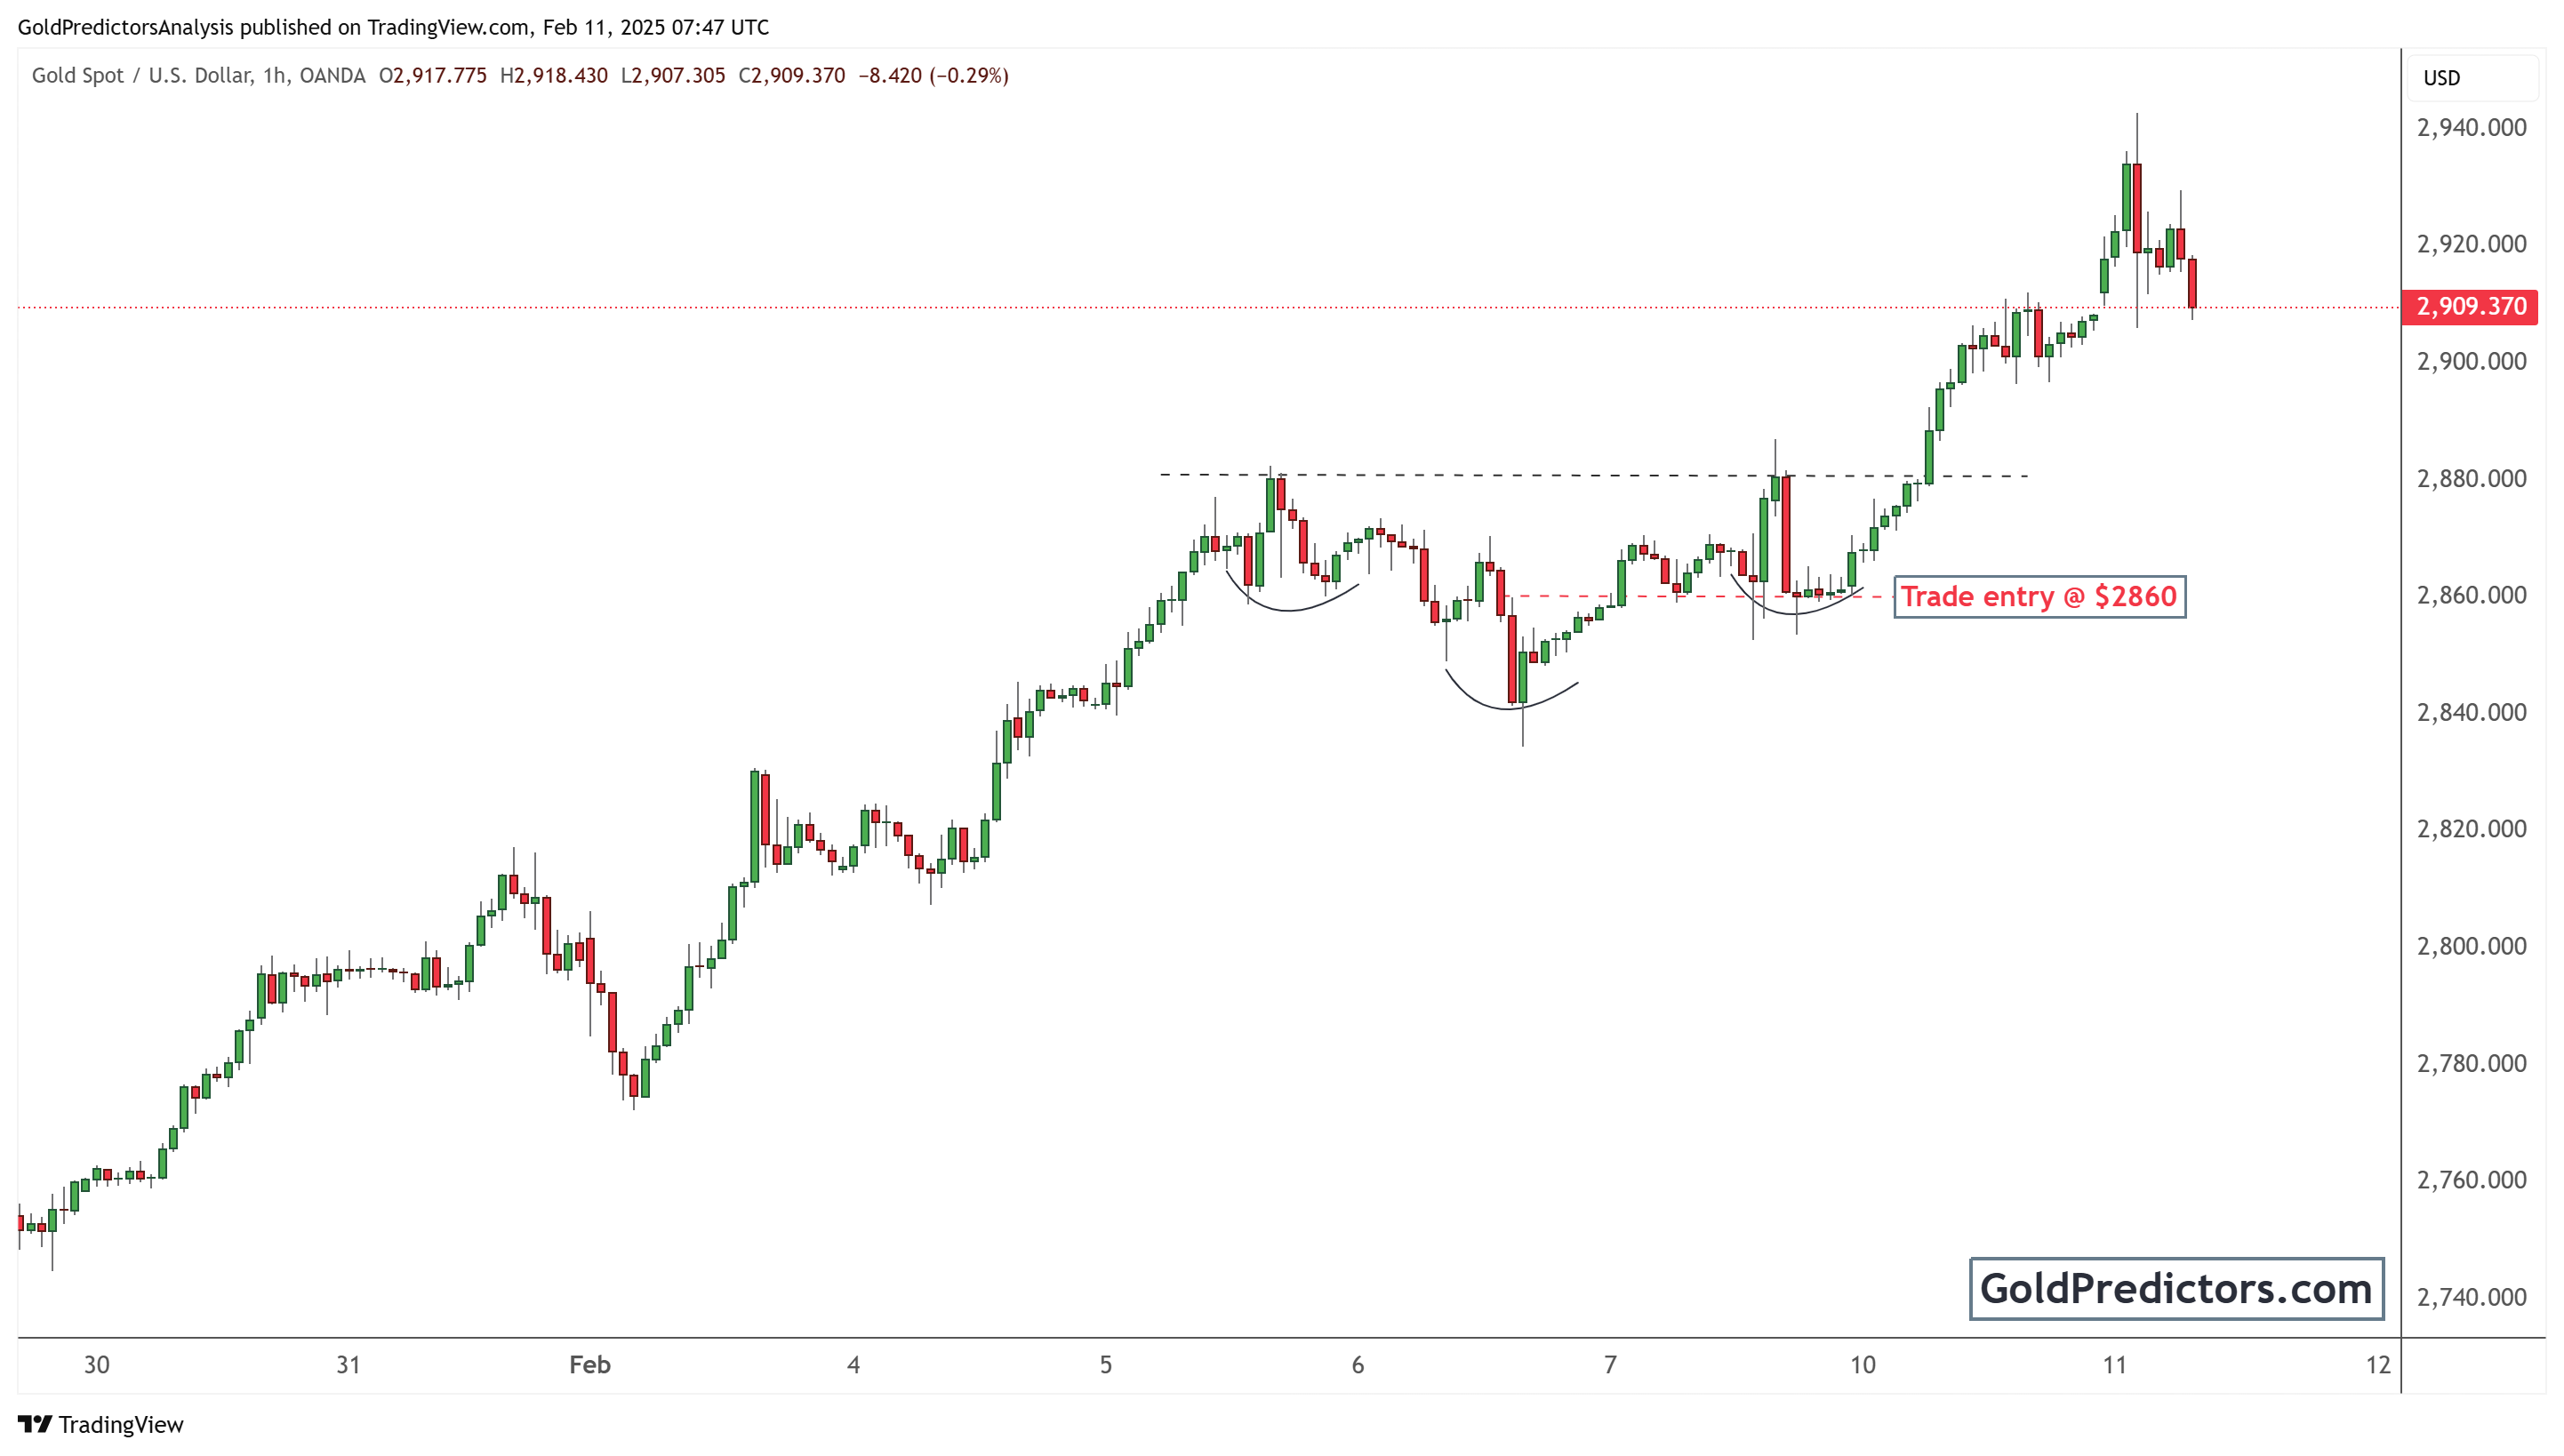
Gold is trading with intense volatility, and traders should strategize effectively for better trading opportunities. For example, traders entered a trade at $2,860, as shown in the chart below, when gold exhibited fluctuations and bullish patterns, signaling a potential breakout during the short-term cycle low. This trade was shared with WhatsApp premium members and has generated strong profits. Traders can capitalize on similar opportunities by executing trades at strategic levels to benefit from high volatility.
Conclusion
Gold continues to rise as market uncertainty and trade tensions boost demand for safe-haven assets. The metal has reached a critical resistance level near $2,900–$3,000, where price action will determine the next move. Investors should monitor upcoming US economic data and Fed policy signals, which could drive further gold volatility. Whether gold breaks higher or consolidates, a strategic approach with risk management is essential for trading in the current market environment.
Unlock exclusive gold and silver trading signals and updates that most investors don’t see. Join our free newsletter now!
Unlock exclusive gold and silver trading signals and updates that most investors don’t see. Join our free newsletter now!
Author

Muhammad Umair, PhD
Gold Predictors
Muhammad Umair is a financial markets analyst and investor who focuses on the forex and precious metals markets.


