Gold prices surge after technical breakout and trade tariff tensions

Gold has consistently been a safe-haven asset, attracting investors during periods of economic uncertainty or geopolitical tensions. Recent developments in global trade, inflation expectations, and monetary policies have significantly impacted gold prices. On January 22, 2025, the gold market showed notable bullish momentum, driven by fundamental and technical factors. This article explores these drivers and provides a detailed technical analysis based on recent chart patterns.
Gold surge after Trump imposes tariff on Canada and Mexico
Gold prices have surged in response to heightened global uncertainties. Hours after his inauguration, U.S. President Donald Trump announced plans to impose 25% tariffs on Canada and Mexico, with implementation as early as February. This announcement has sparked fears of a new global trade war, driving demand for safe-haven assets like gold.
Additionally, signs of easing inflation in the U.S. have led to speculation that the Federal Reserve may consider rate cuts later this year. This outlook has caused U.S. Treasury bond yields to decline, further supporting gold prices. The Israel-Hamas ceasefire agreement and hopes for a potential resolution to the Ukraine conflict have also contributed to the overall market optimism. However, a stronger U.S. dollar has tempered the risk-on mood. Upcoming events, such as the Bank of Japan’s policy decision and global PMI data, will likely introduce more volatility and provide further direction for gold.
Gold technical breakout and surge potential
Gold's price action exhibits a well-defined ascending channel, as illustrated in the chart below. The price has consistently formed higher and lower highs, demonstrating a strong bullish trend. The recent breakout above $2,720 confirms the continuation of this upward momentum. A double-bottom pattern, highlighted earlier, acted as a reversal signal, pushing the price higher.
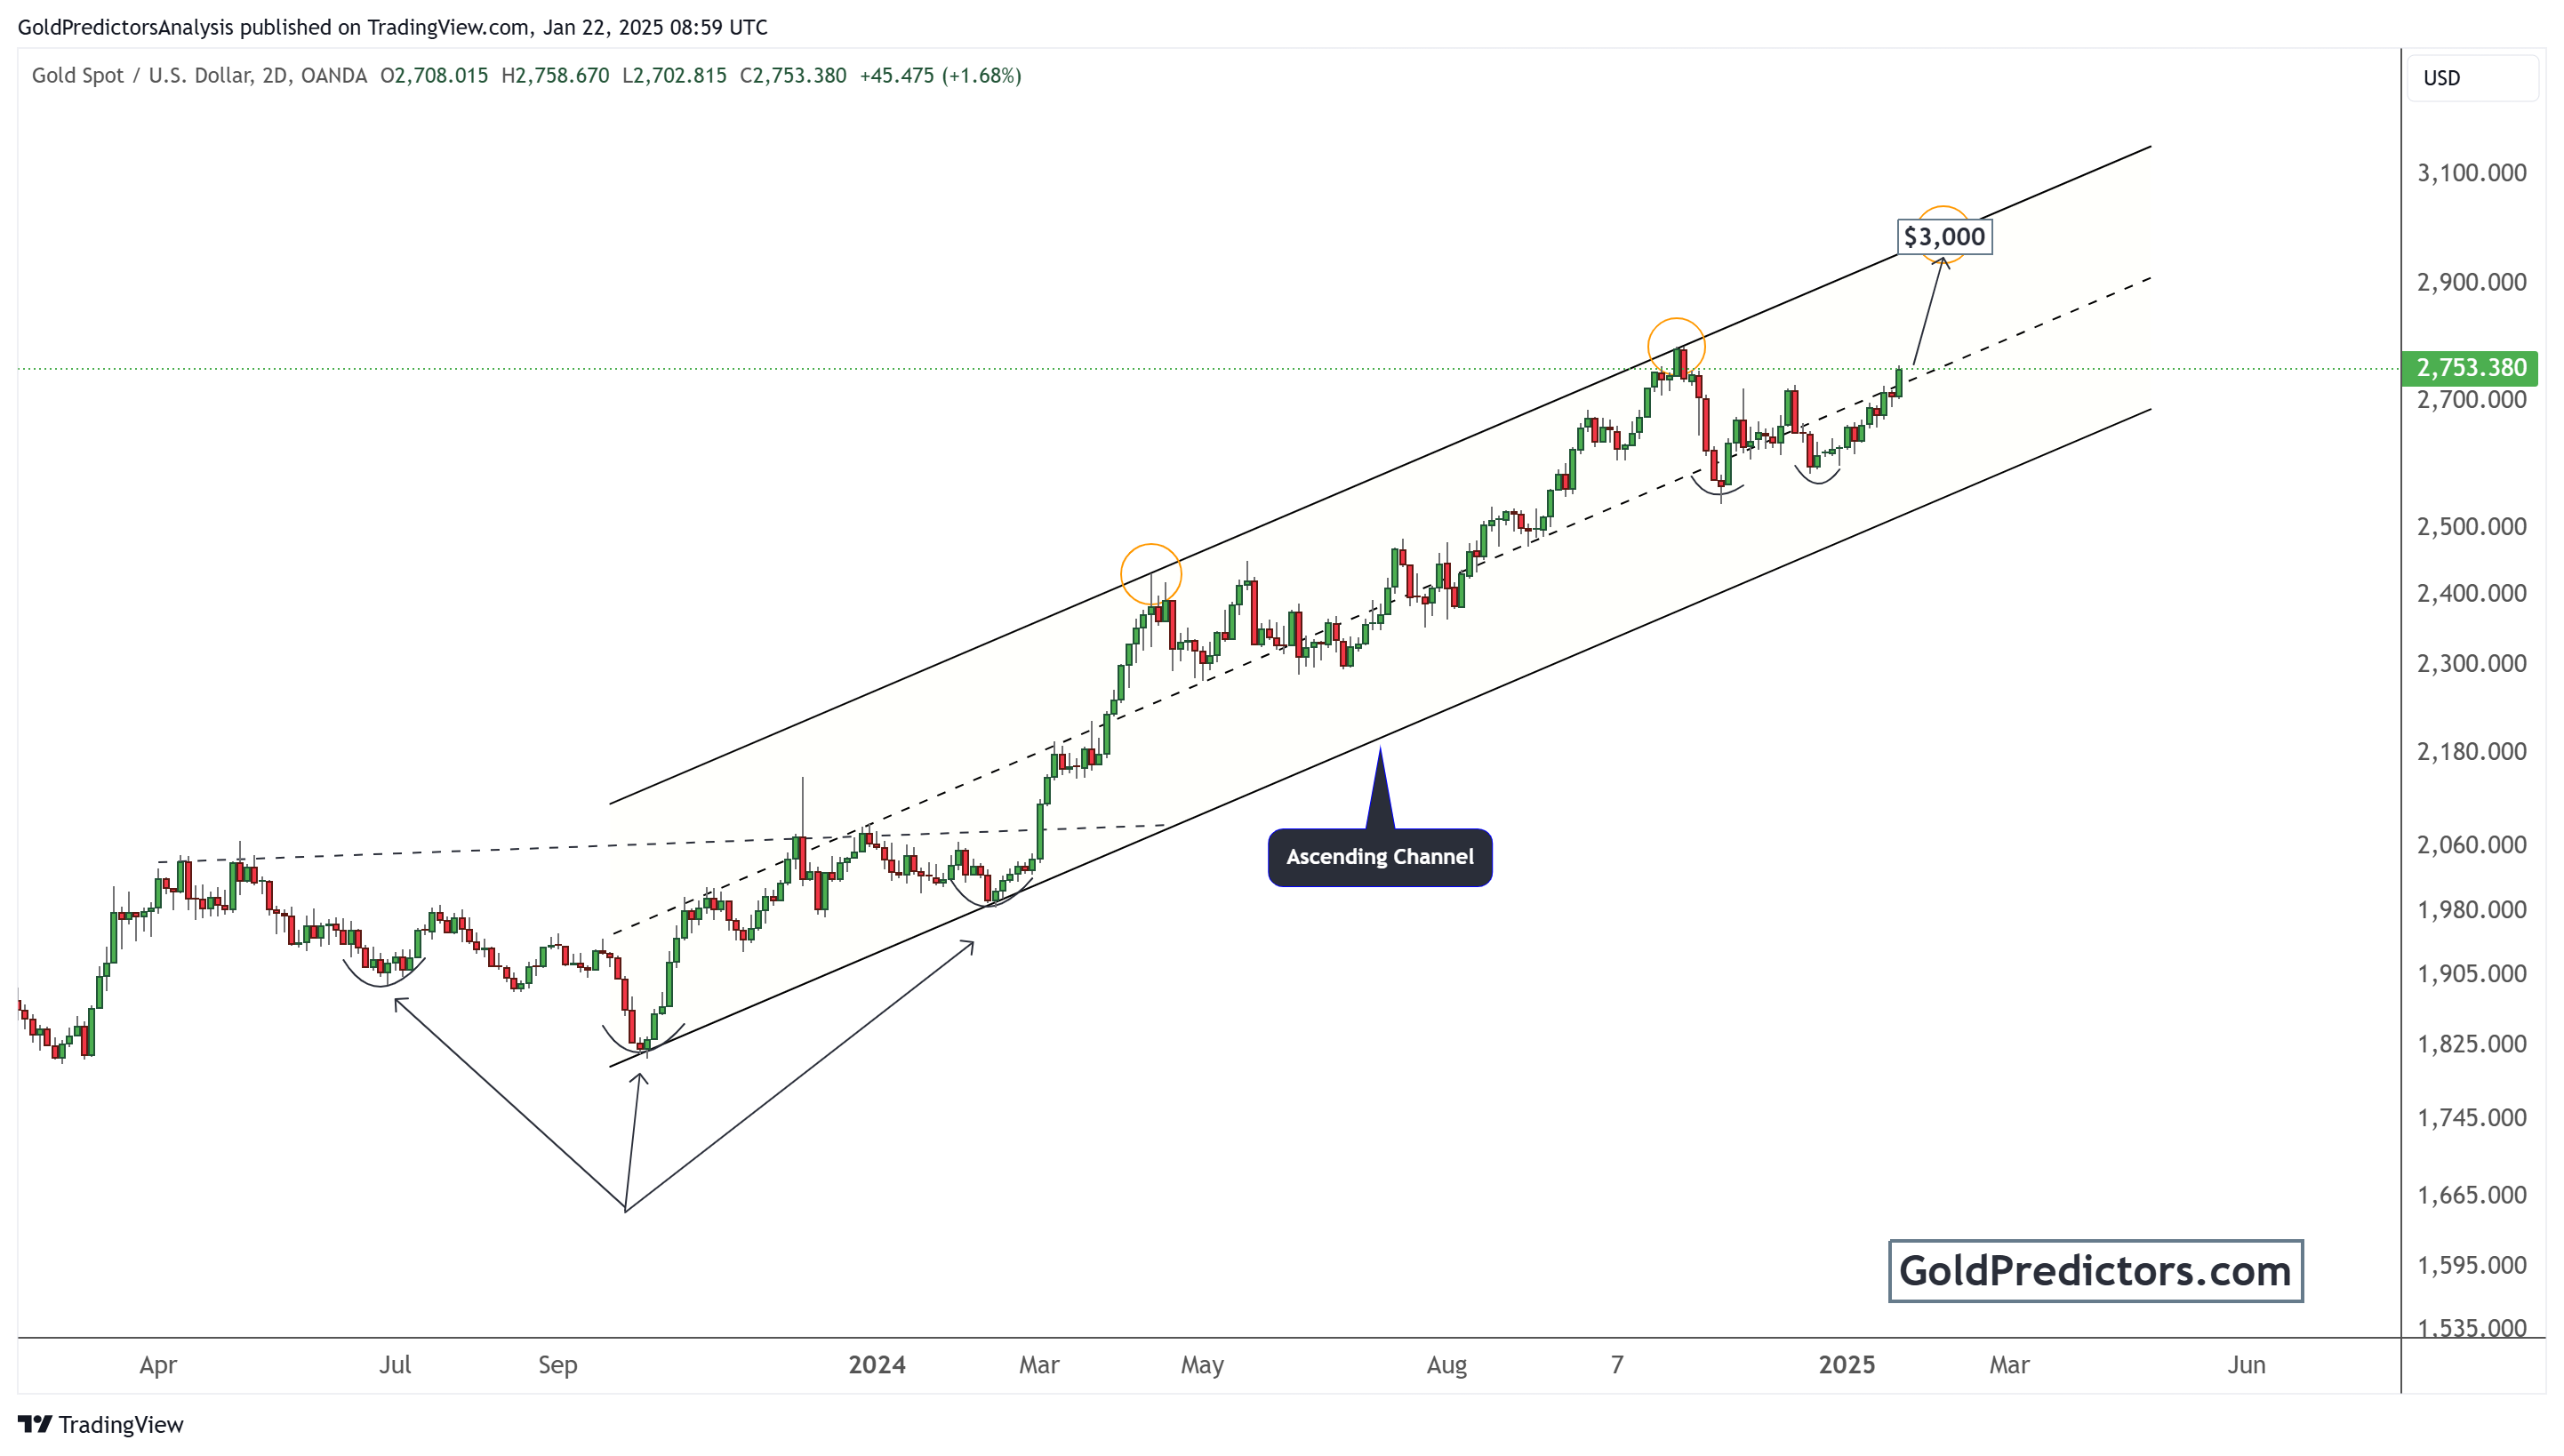
Currently, gold is trading around $2,753, showing a clear pathway toward the $3,000 zone, as indicated by the channel's upper boundary. The key resistance levels to watch are $2,790 and $3,000, while support can be seen around the $2,700 zone. The bullish momentum may accelerate further if the price breaks above $3,000. The chart also highlights the importance of the midline within the channel, which has acted as a dynamic support and resistance level throughout this trend.
Conclusion
Gold's bullish rally appears to be gaining strength, supported by fundamental and technical factors. Geopolitical tensions, potential changes in U.S. monetary policy, and global trade uncertainties continue to drive demand for the precious metal. With its ascending channel and key resistance levels, the technical setup reinforces the possibility of gold reaching the $3,000 zone in the near term. Investors should closely monitor upcoming economic data and central bank decisions, which could introduce significant volatility and shape the future direction of gold prices.
Unlock exclusive gold and silver trading signals and updates that most investors don’t see. Join our free newsletter now!
Unlock exclusive gold and silver trading signals and updates that most investors don’t see. Join our free newsletter now!
Author

Muhammad Umair, PhD
Gold Predictors
Muhammad Umair is a financial markets analyst and investor who focuses on the forex and precious metals markets.


