Gold price to decline based on bond yield moves

Never question the authority. It doesn’t know either.
Historical data reveals uncertainty
The bond yields are declining, so gold must be going up – that is what we are hearing and reading over and over again.
On numerous occasions, I emphasized that gold is most likely to move in the opposite to real yields, not nominal ones, but the discussion keeps returning. Let’s dig deeper.
Of course, there will be cases when gold moves in the opposite way to nominal yields (e.g. the 2-year yields), but the key thing is that it is only the link between real yields and gold that is reliable without further consideration.
Nominal Yield = Real Yield + Projected Inflation
In other words:
Real Yield = Nominal Yield – Projected Inflation
Why? Imagine that the nominal yield is growing steadily, but the inflation is rallying sharply and is expected to do so. In this case, the real yield would be declining.
What would gold be likely to do in this environment? It would rally because the inflation-hedge effect would be stronger than the increased “alternative cost” of holding gold that provides no interest (no yield – except when the metal is leased).
In the opposite situation, nominal yields could be declining, but if inflation is falling faster, then real yields could actually be rising, meaning that gold price would be likely to decline.
There are some other factors that need to be considered, like the USD Index, but my point here is: it is the real yield that has a clear impact on gold. In case of nominal yields, the impact might (or might not!) be as clear.
This means that it’s imperative to look what’s really happening with the bond yields AND how gold used to perform in similar situations before stating that this or that is the likely implication.
Some authorities might tell you that bond yields and gold have to move in opposite directions. I’m suggesting that you question those authorities. In fact, that’s what I’m going to do below.
I prepared three charts for you featuring the 2-year bond yield that are likely to shed extra light on the link that to many seems clearer than it should.
Let’s start with the basic “zoom-out” technique.
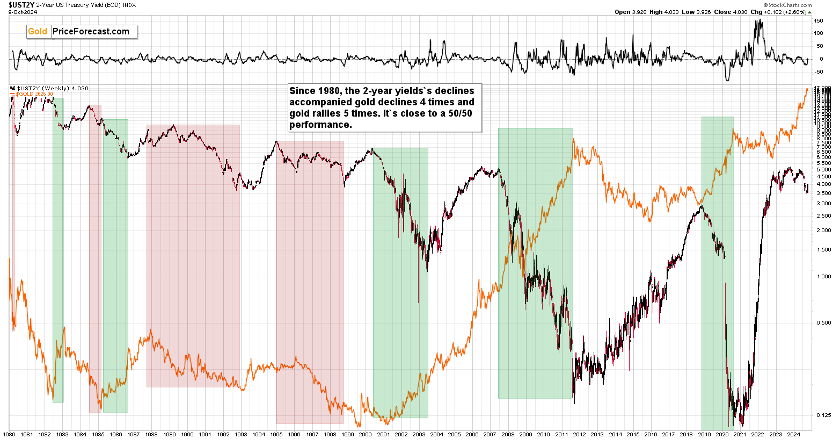
What you might read about gold and the yields is that it moves in the opposite directions, and usually the period between 2000 and now is presented on the chart. It does indeed cover three periods when the yields fell and gold rallied at the same time.
The flaw in this analysis is that it assumes that gold hasn’t formed a major top right now. If it did, then the link to the period between 1980 and 2001 becomes more important, and back then most periods when the yields declined were characterized by declining gold prices.
If we take both periods into account (so, by discarding the assumption that gold either topped or that it didn’t top), we get to the conclusion that indications from bond yields’ declines are rather unclear.
This might (should) raise a few eyebrows. Let’s make it more interesting by adding an extra layer on top of the above analysis.
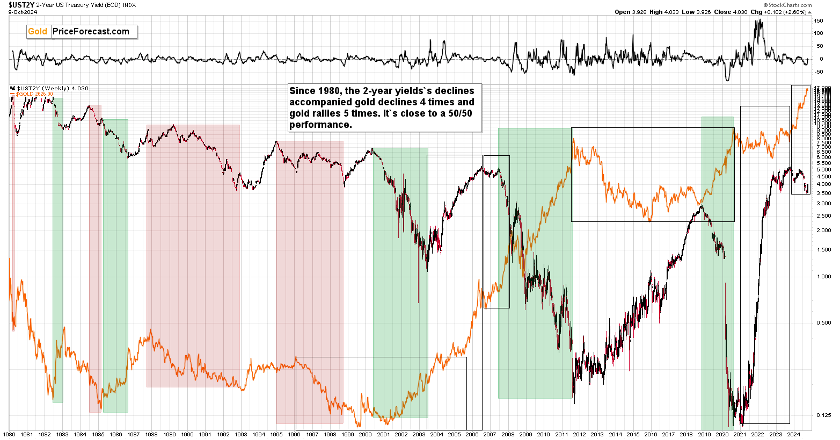
I marked two very distinct periods – ones when gold formed multi-year cup-and-handle patterns. That was around the 2000 and around the 2015 bottoms.
In the second half of the pattern, we saw a rally in both: gold and bond yields (marked with the second rectangle). The rallies started from (approximately) a local low in gold and when bond yields topped, so did gold.
The really interesting thing is what happened in the areas marked with the third triangle. That’s when the price of gold soared while bond yields declined.
In the previous pattern, this continued until we saw a move back up in the yields. That, my friends, was the 2008 top that preceded profound declines in gold, stocks, and – most importantly – mining stocks.
What we see now is that bond yields are after a decline, and they just moved back up as gold topped.
Given the above-described analogy, the recent top was likely a really major top – one that marks the end of a medium-term upswing, and a clear sign that investors should prepare (or already be prepared) for a wild ride to lower price levels – especially in mining stocks.
Of course, this is not a signal that is likely to work in terms of days – it’s likely to have a critical impact in terms of months (and perhaps weeks). And it doesn’t invalidate some of the long-term opportunities in the precious metals market.
So, yes, looking at the moves in 2-year bond yields and how it impacted gold in the past doesn’t have to look so bullish as most people portray it. There is a bearish sign here as well – a quite profound one.
But wait, there’s more!
Bearish signs ahead
Price moves and price patterns are both important, but we all read the phrase that time is more important than price, right? When the time is right, the price will reverse – was the continuation of this quote.
With the above in mind, let’s turn back to the period that is usually viewed as bullish for gold.
This time let’s consider when the rallies really ended.
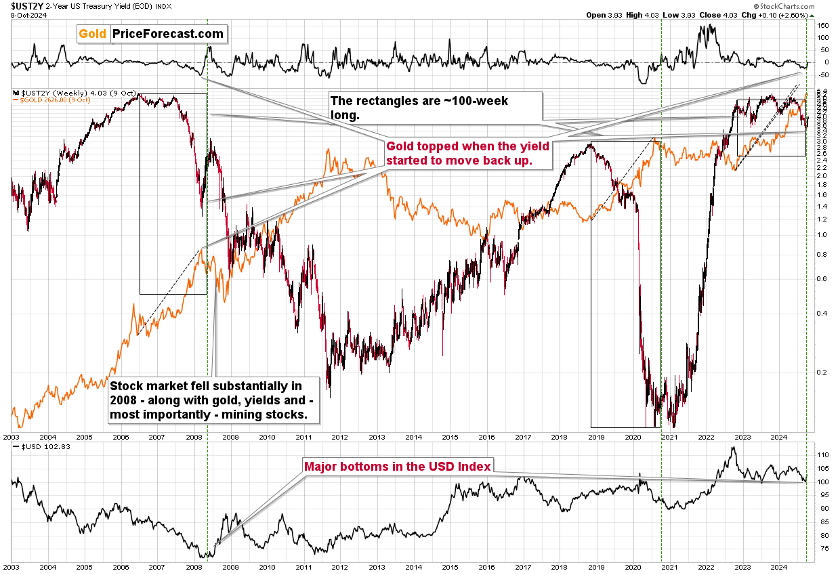
The 2008 top was when the rally ended, even though yields then traded sideways for a long time before declining. While they were trading sideways, gold was moving higher.
The 2018 top was followed by an immediate decline and gold rallied.
Now, the key thing: when did gold top after those rallies?
In both cases, gold topped approximately 100 weeks after the rally in bond yields ended. That’s how wide the black rectangles are.
Guess what – recently, bond yields stopped rallying in 2022 and we’re about 100 weeks after that moment. Oops…
Also, please note that in both most similar cases (based on both above charts): in 2008 and now, we saw a major bottom in the USD Index that formed after a significant.
(taking about 2 years) decline. Given last week’s powerful rally in the USD Index, those situations seem alike also from this angle.
The declines are coming – especially in junior mining stocks. Miners declined profoundly in 2008, and juniors are likely to decline more than senior miners if the stock market declines (which is likely to happen). While this might seem improbable now (hint: it usually seems improbable before a really big move takes place), in my opinion, this decline in junior miners is likely to create many small fortunes for those that are positioned correctly. Of course, that’s just my opinion, but – as you see above – research-backed one.
Want free follow-ups to the above article and details not available to 99%+ investors? Sign up to our free newsletter today!
Want free follow-ups to the above article and details not available to 99%+ investors? Sign up to our free newsletter today!
Author

Przemyslaw Radomski, CFA
Sunshine Profits
Przemyslaw Radomski, CFA (PR) is a precious metals investor and analyst who takes advantage of the emotionality on the markets, and invites you to do the same. His company, Sunshine Profits, publishes analytical software that any


