Gold price holds bullish structure amid short-term pullback and geopolitical tensions

Gold (XAUUSD) has been a hedge in times of uncertainty. Investors often turn to it during global turmoil or when the financial markets show distress. Recent price action shows gold continuing its bullish momentum, driven by technical and fundamental factors. After decades of consolidation and repeated attempts, gold finally broke above a key long-term resistance line. This breakout may begin a new bullish cycle, with global events further boosting its safe-haven appeal. However, the prices are in correction mode from $3,500, which makes the short-term direction uncertain until the $3,500 is broken.
Gold prices surge as geopolitical tensions and Fed pause drive safe-haven demand.
Gold remains a preferred safe-haven asset amid rising global tensions. Investors seek safety due to the ongoing Russia-Ukraine war and unrest in the Middle East. These risks increase the demand for non-yielding assets like gold. Uncertainty in global diplomacy boosts gold’s long-term value.
The Federal Reserve’s recent decision to pause rate hikes adds further support. The central bank maintained interest rates between 4.25% and 4.5%. Fed Chair Jerome Powell emphasized caution due to economic uncertainties. This stance weakens the US Dollar, supporting gold prices in the short term.
Trade war tensions between the US and China also play a key role. President Trump ruled out lowering 145% tariffs on China. His statement reduced optimism around upcoming trade talks. Uncertainty around trade developments adds pressure on the markets. This cautious sentiment continues to favor gold as a store of value.
Gold bullish structure after multi-year resistance breach
The chart below shows a long-term technical breakout in gold above a multi-decade resistance line. This resistance line, originating from the 1980 high, was tested again during the 2011 and 2020 peaks but held firm until now. In early 2024, gold finally broke through this line, signaling a major structural shift in the long-term trend.
Two key breakout levels are visible: around $2,200 and near $2,800. The first breakout, from a rounded bottom formation, suggests strong accumulation over several years. The second breakout above the $2,800 level confirms upward momentum and a bullish continuation. Price action above these levels indicates strong buying interest and trend confirmation.
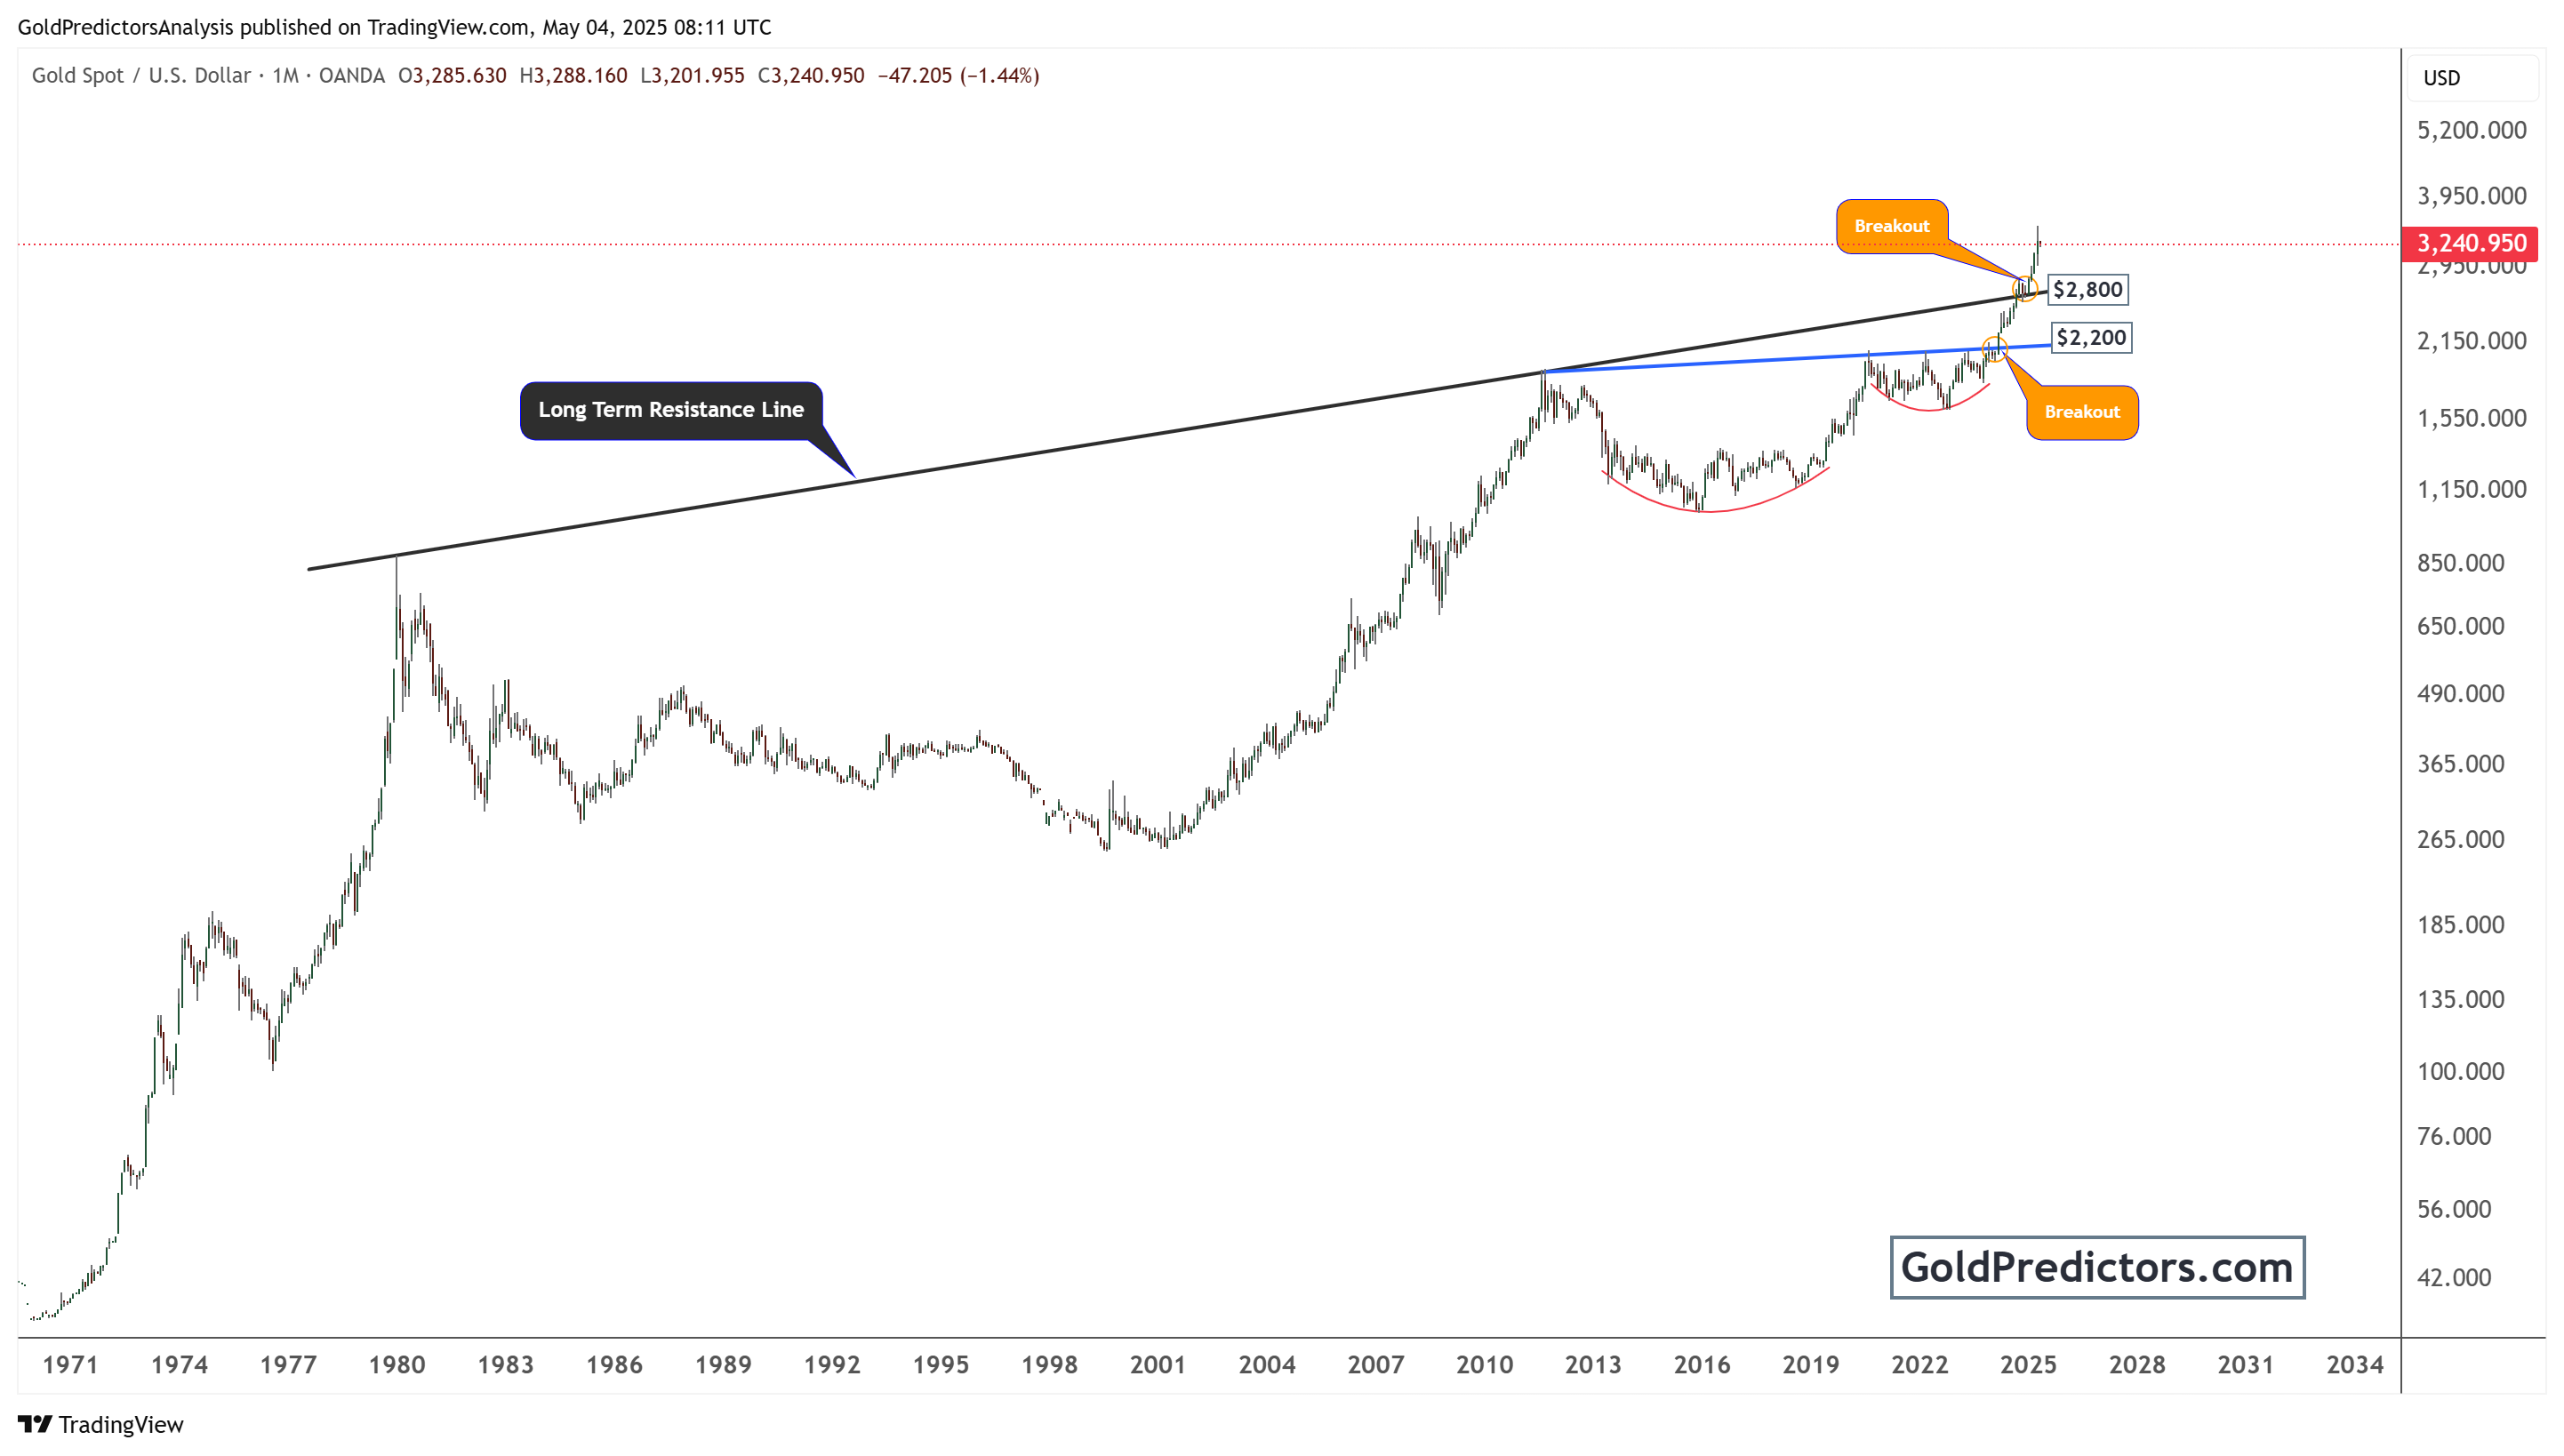
With the current price around $3,337, gold trades well above both breakout points. This confirms the long-term uptrend is intact and accelerating. If momentum continues, we could see price targets well beyond historical highs. Traders may view any pullbacks toward $2,800 or $2,200 as buying opportunities.
Conclusion
Gold price retreats after testing the $3,414–3,415 area, slipping to the lower end of its daily range. The Fed’s hawkish pause keeps US yields and the Dollar supported, capping gold’s upside. Uncertainty over the US-China trade deal and ongoing geopolitical risks, including the Russia-Ukraine war and Middle East tensions, continue to support gold’s safe-haven appeal. Trump’s refusal to lower the 145% tariffs on China dampens hopes for quick progress. Investors remain cautious amid unclear outcomes from upcoming trade negotiations.
Unlock exclusive gold and silver trading signals and updates that most investors don’t see. Join our free newsletter now!
Unlock exclusive gold and silver trading signals and updates that most investors don’t see. Join our free newsletter now!
Author

Muhammad Umair, PhD
Gold Predictors
Muhammad Umair is a financial markets analyst and investor who focuses on the forex and precious metals markets.


