Gold Price Forecast: XAUUSD set to test $1,750, focus on United States data
- Gold price is stalled a two-day corrective decline on the final trading day of the week.
- China reopening optimism mars the US Dollar rebound while US Treasury yields retreat.
- Gold price eyes 50-Simple Moving Average support on the 4H chart amid bearish RSI.

Gold price is trading modestly flat so far this Friday, as bears take a breather following two straight days of the corrective decline from a three-month top at $1,787. Despite, trading close to the best levels since August, gold price is set to end the week in the red.
US Dollar pulls back despite hawkish Federal Reserve comments
Gold price is consolidating recent losses, as the US Dollar rebound fizzles out in Asia this Friday. Investors turn more optimistic on China on reopening prospects, especially after Goldman Sachs said Thursday, Chinese Gross Domestic Product (GDP) growth will likely pick up in the second half of 2023 and into 2024 after the economy weathers the initial negative impact exiting its Covid Zero strategy in the spring, per Bloomberg.
Additionally, the US Dollar is also bearing the brunt of the USDJPY sell-off after Japan’s Consumer Price Index surged to a 40-year high and fanned expectations of a hawkish Bank of Japan (BoJ) pivot, which put a bid under the Japanese Yen. The retreat in the Treasury bond yields from the United States also collaborated with the US Dollar’s U-turn while lending some support to Gold price.
On Thursday, the US Dollar staged a solid rebound in tandem with the US Treasury bond yields after hawkish remarks from the US Federal Reserve (Fed) policymaker. St. Louis Fed President James Bullard said that the benchmark interest rate may need to rise as high as 7% to put downward pressure on inflation. He added that “to attain a sufficiently restrictive level, the policy rate will need to be increased further.” The benchmark 10-year Treasury bond yields from the United States jumped from a six-week low near 3.70%, trading at 3.76%, as of writing.
Focus shifts toward the United States Existing Home Sales data
After softer United States Producer Price Index (PPI) and Consumer Price Index (CPI) data from the United State ramped up expectations of a 50 basis points (bps) rate hike by the US Federal Reserve in December, another sign of US housing market cooling could add to the latest leg down in the US Dollar. On Thursday, The number of Building Permits in the United States dropped by 2.4% to 1,526K, its lowest since June 2020 while Housing Starts fell by 4.2% to 1,425k.
Friday will see the United States Existing Home Sales dropping in at 15:00 GMT, with a mild downtick to 4.38M expected in October when compared to the previous print of 4.71M. Should the US data disappoint by a wide margin, it could reinforce expectations of a Federal Reserve slowdown in the tightening pace. The resultant US Dollar weakness could revive the uptrend in Gold price. However, the end-of-the-week flows could play out and keep Gold bulls on the edge, with attention turning toward next week’s Federal Reserve meeting minutes.
Gold price technical outlook: Four chart
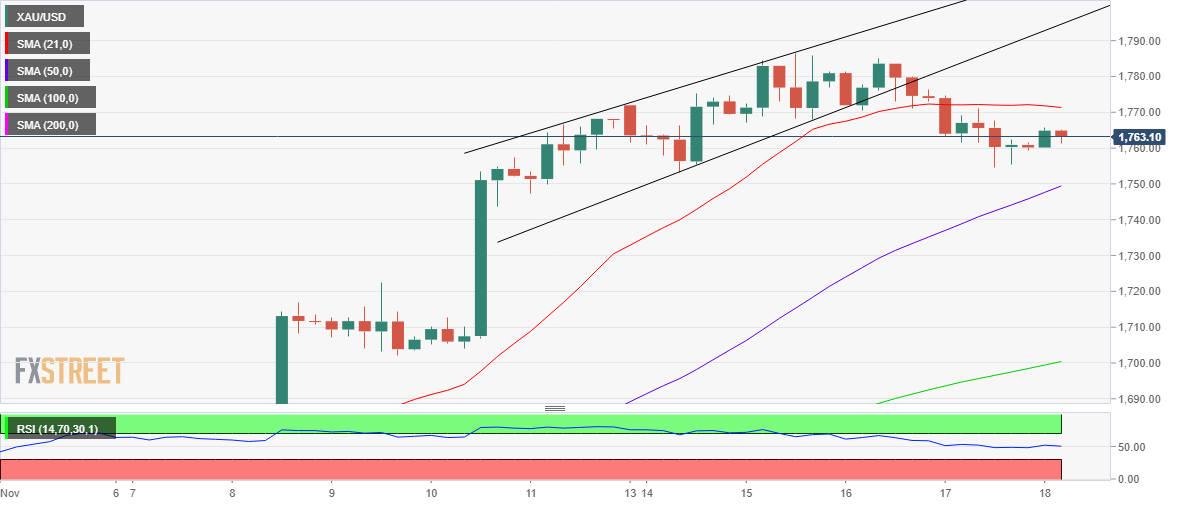
Gold price is holding lower ground while below the horizontal 21-Simple Moving Average (SMA) at $1,771 on a four-hour time frame.
The downside risks remain intact amid a rising wedge pattern in play and a bearish Relative Strength Index (RSI), currently at 49.40.
Sellers now need a sustained break below the weekly low at $1,755 to challenge the psychological $1,750 barrier, where the bullish 50-SMA coincides. The next downside target is seen at the $1,740 round number.
On the upside, buyers need to find acceptance above the 21-SMA to revive the uptrend. The rising wedge support-turned-resistance at $1,794 will be next on their radars.
Premium
You have reached your limit of 3 free articles for this month.
Start your subscription and get access to all our original articles.
Author

Dhwani Mehta
FXStreet
Residing in Mumbai (India), Dhwani is a Senior Analyst and Manager of the Asian session at FXStreet. She has over 10 years of experience in analyzing and covering the global financial markets, with specialization in Forex and commodities markets.


