Gold Price Forecast: XAU/USD’s struggle with $3,400 extends amid Middle East escalation
- Gold price closes in the bullish opening gap as sellers fight back control early Monday.
- US Dollar strengthens on risk aversion due to the US involvement in the Israel-Iran conflict.
- Gold price falls back to the critical 21-day SMA support at $3,351, with the bullish daily RSI.

Gold price has come under moderate selling pressure and reverts toward $3,350 early Monday, having faced rejection just shy of the $3,400 threshold.
Gold price awaits US PMIs, Fedspeak amid Middle East woes
In doing so, Gold price filled in the bullish opening gap of about $25, led by the market’s reaction to the weekend news of the US military involvement in the Israel-Iran conflict.
Early Sunday, US President Donald Trump announced that the United States (US) carried out airstrikes on three of Iran’s most critical nuclear sites, Fordow, Natanz and Isfahan.
In response, Supreme Leader Ayatollah Khamenei warned that American involvement would bring “irreparable damage.”
Markets fret over the Israel-Iran conflict translating into a wider Middle East regional war if Iran opts to retaliate with the closure of the Strait of Hormuz, which is the key passage of oil exports.
This nervousness has strengthened the haven demand for the US Dollar (USD), weighing on the USD-denominated Gold price.
Further, markets seem to believe that Iran may refrain from escalating the conflict by way of blocking the Strait of Hormuz even though its parliament has approved such a move.
This narrative appears to have reinforced selling in Oil prices, rendering negative for the inflation-hedge Gold price. Markets believed the Middle East escalation-driven surge in Oil price could stoke inflationary fears worldwide.
Attention now turns to the preliminary readings of S&P Global PMI data, especially from the Euro area and the US to gauge the health of the economies globally.
Downbeat data could rekindle global growth concerns, reviving the safe-haven appeal of the Gold price.
Additionally, if Iran retaliates firmly to the US bombing by accelerating its attacks on Israel and US bases, buyers could swing back in action amid investors’ run for cover in the ultimate traditional haven Gold price.
Speeches from several US Federal Reserve (Fed) policymakers will also be closely scrutinized after the Fed’s hawkish hold policy decision last week.
Gold price technical analysis: Daily chart
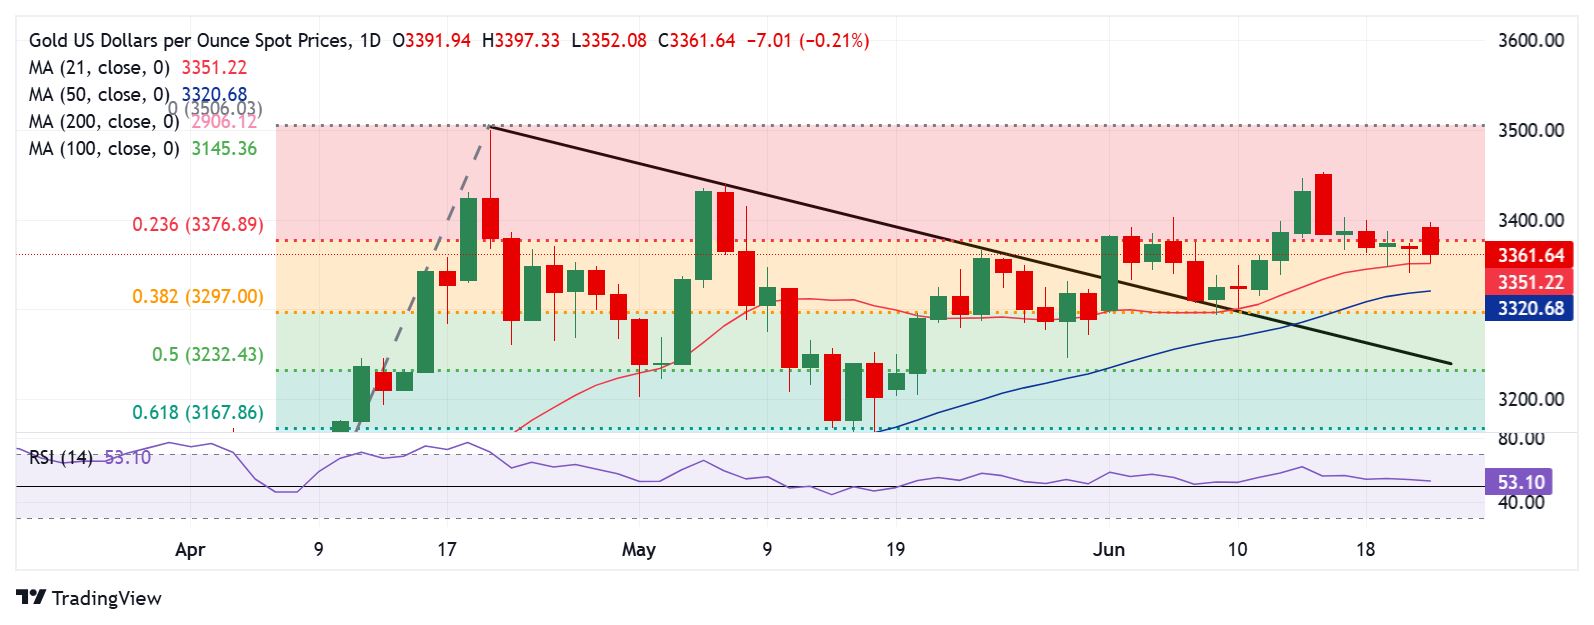
The daily chart shows that Gold price is back to testing the critical short-term support of the 21-day Simple Moving Average (SMA) at $3,351, breaching the 23.6% Fibonacci Retracement (Fibo) level of the April record rally once again at $3,377.
A failure to resist above the 21-day SMA on a daily closing basis will open up a fresh downtrend toward the 50-day SMA at $3,321, below which the 38.2% Fibo level at $3,297 will be threatened.
That said, Gold buyers remain hopeful so long as the 14-day Relative Strength Index (RSI) holds above the midline. The leading indicator is currently pointing south, near 53.
If the bright metal stages a comeback, it will need acceptance above the mentioned support-turned-resistance at $3,377.
The next topside target is seen at $3,400, above which the static resistance at $3,440 will be tested.
Buyers will then take on the two-month highs of $3,453.
Gold FAQs
Gold has played a key role in human’s history as it has been widely used as a store of value and medium of exchange. Currently, apart from its shine and usage for jewelry, the precious metal is widely seen as a safe-haven asset, meaning that it is considered a good investment during turbulent times. Gold is also widely seen as a hedge against inflation and against depreciating currencies as it doesn’t rely on any specific issuer or government.
Central banks are the biggest Gold holders. In their aim to support their currencies in turbulent times, central banks tend to diversify their reserves and buy Gold to improve the perceived strength of the economy and the currency. High Gold reserves can be a source of trust for a country’s solvency. Central banks added 1,136 tonnes of Gold worth around $70 billion to their reserves in 2022, according to data from the World Gold Council. This is the highest yearly purchase since records began. Central banks from emerging economies such as China, India and Turkey are quickly increasing their Gold reserves.
Gold has an inverse correlation with the US Dollar and US Treasuries, which are both major reserve and safe-haven assets. When the Dollar depreciates, Gold tends to rise, enabling investors and central banks to diversify their assets in turbulent times. Gold is also inversely correlated with risk assets. A rally in the stock market tends to weaken Gold price, while sell-offs in riskier markets tend to favor the precious metal.
The price can move due to a wide range of factors. Geopolitical instability or fears of a deep recession can quickly make Gold price escalate due to its safe-haven status. As a yield-less asset, Gold tends to rise with lower interest rates, while higher cost of money usually weighs down on the yellow metal. Still, most moves depend on how the US Dollar (USD) behaves as the asset is priced in dollars (XAU/USD). A strong Dollar tends to keep the price of Gold controlled, whereas a weaker Dollar is likely to push Gold prices up.
Premium
You have reached your limit of 3 free articles for this month.
Start your subscription and get access to all our original articles.
Author

Dhwani Mehta
FXStreet
Residing in Mumbai (India), Dhwani is a Senior Analyst and Manager of the Asian session at FXStreet. She has over 10 years of experience in analyzing and covering the global financial markets, with specialization in Forex and commodities markets.