Gold Price Forecast: XAU/USD’s fate hinges on Treasury yields, Powell’s speech
- Gold struggles with its rebound as DXY firms up with Treasury yields.
- Risk-aversion amid reflation fears offers some support to XAU/USD.
- Gold remains at the mercy of Treasury yields dynamics and Powell.

Gold (XAU/USD) reached fresh nine-month lows at $1702 amid a renewed uptick in the US Treasury yields, as the bond market turmoil resumed on Wednesday. Gold managed to recover some ground and finished the day at $1714, still losing significantly on a daily basis. The latest remarks from Chicago Fed President Charles Evans, citing that the recent rise in yields signaled optimism on the economic outlook, powered the latest leg up in the yields. Meanwhile, upbeat US ISM Services PMI outweighed the sluggish ADP jobs report, boosting the Treasury yields along with the greenback.
As risk-aversion continues to remain the main theme so far this Thursday, gold bulls are licking their bulls while attempting a tepid recovery. The surge in Treasury yields led to a sharp sell-off in the global stocks, as investors remain worried about a potential overheating of the economy. The US Senate delayed the start of debate on a $1.9 trillion stimulus bill until at least Thursday, which also added to the jittery market conditions.
In the day ahead, if the risk-off mood intensifies, it could bolster the haven-demand for the US dollar and limit the corrective pullback in gold. Also, traders are likely to remain cautious and would refrain from placing any directional bets on gold ahead of the Fed Chair Jerome Powell’s appearance scheduled today at 1705 GMT.
Gold Price Chart - Technical outlook
Gold: Four-hour chart
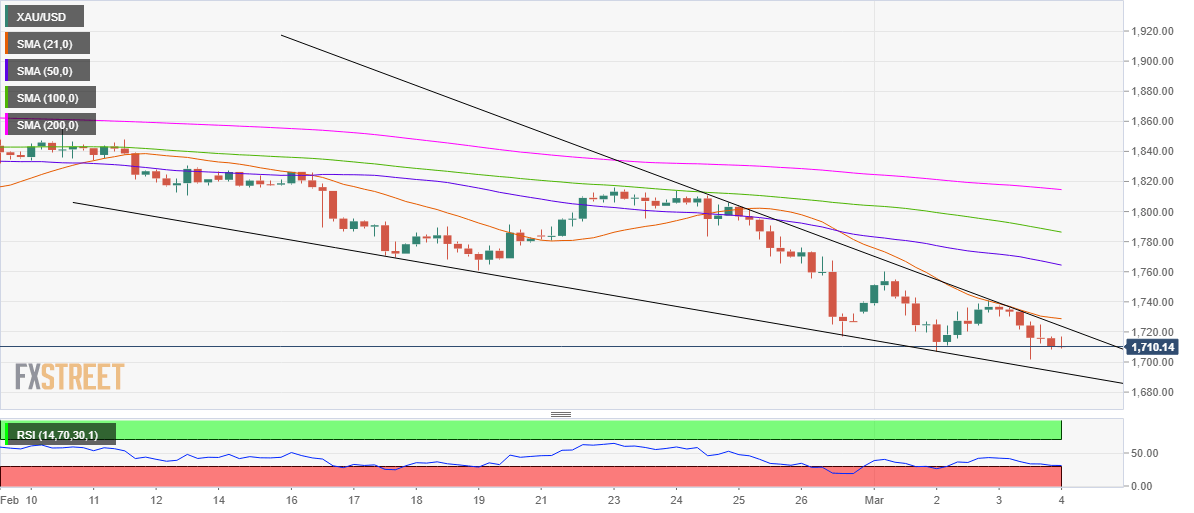
Gold’s four-hour chart shows that the price is trading in an extremely narrow range within a falling wedge formation, with a powerful resistance aligned at $1724.
A four-hour candlestick closing above that latter would validate a falling wedge breakout, calling for an extension of the recovery momentum.
Although the bearish 21-simple moving average (SMA) at $1729 could challenge the bullish commitments.
The next significant upside barrier awaits at the $1750 psychological level, above which the downward-sloping 50-SMA at $1764 could be probed.
The Relative Strength Index (RSI) edges lower towards the oversold territory, suggesting that the sellers could likely retain control in the near-term.
Therefore, a break below the $1700 level cannot be ruled, below which the critical $1692 support could be put to test. That level is the intersection of the 21-monthly moving average and falling wedge support on the said time frame.
Further south, the June 2020 low of $1670 will be on the sellers’ radars.
Premium
You have reached your limit of 3 free articles for this month.
Start your subscription and get access to all our original articles.
Author

Dhwani Mehta
FXStreet
Residing in Mumbai (India), Dhwani is a Senior Analyst and Manager of the Asian session at FXStreet. She has over 10 years of experience in analyzing and covering the global financial markets, with specialization in Forex and commodities markets.


