Gold Price Forecast: XAU/USD’s bullish potential appears limited despite dovish Powell
- Gold price attempts a minor bounce despite a broad USD comeback.
- Subdued Treasury yields lend support while dovish Powell also underpins.
- Gold price wavers in a symmetrical triangle on the 4H chart, with bearish RSI.

Gold price witnessed good two-way businesses on Tuesday, as the bears regained control following an earlier advance to $1790. Gold price fell as low as $1772 before reversing to $1779 at the close. Despite a minor rebound, the yellow metal finished in the red amid a sharp recovery in the risk sentiment. The much-awaited testimony from Fed Chair Jerome Powell turned out to be dovish, which eased tightening fears fuelled by last week’s hawkish surprise from the world’s most powerful central bank. Investors also cheered Powell’s dismissal of the inflation concerns, which lifted the stocks while knocking off the US dollar alongside the Treasury yields.
Gold price is looking to find its feet, trapped in a subdued trading range so far this Wednesday. The US dollar’s rebound appears to be capping the upside attempts in gold price while the recent weakness in the Treasury yields and a cautious risk tone underpins. Gold also benefits from Fed Chair Powell’s weaker rhetoric on its monetary policy and rising covid case in the Asian regions. Looking ahead, the Eurozone and the US preliminary Manufacturing and Services PMI reports will be closely eyed for fresh hints on the pace of the global economic recovery. Meanwhile, the US stimulus updates and the dynamics in the yields and the dollar will continue to remain the main driver of gold prices.
Gold Price Chart - Technical outlook
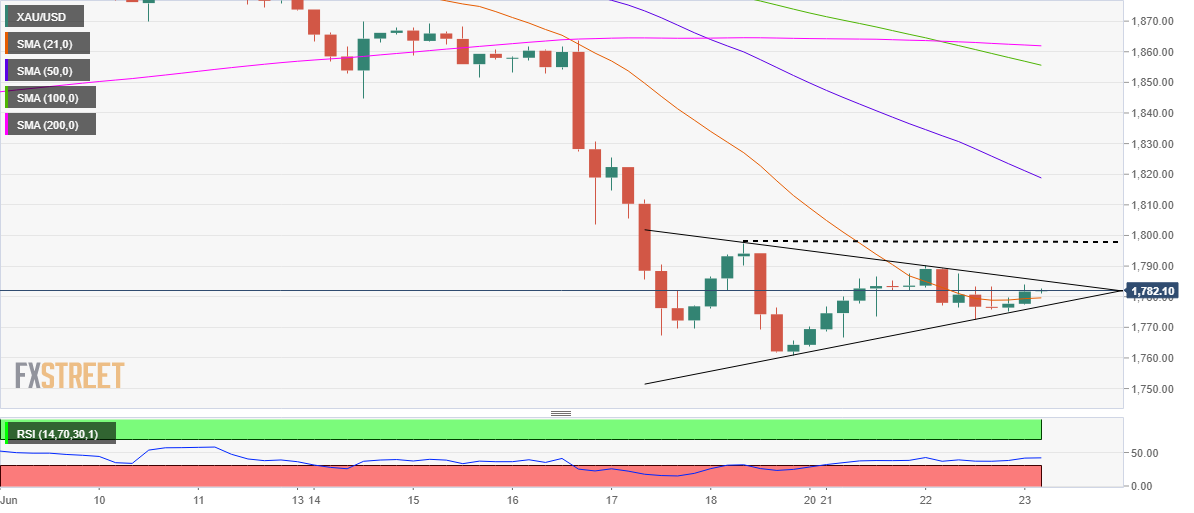
Gold: Four-hour chart
As observed on gold’s four-hour chart, the price is wavering in a symmetrical triangle formation since the Fed-led blow last week.
At the time of writing, gold price is on the verge of yielding a symmetrical triangle breakout if it closes the four-hour candlestick above the falling trendline resistance at $1785.
The next upside target awaits at $1797, the dashed horizontal trendline resistance.
Further up, the $1800 round number will threaten the bulls. If the bulls succeed in recapturing the latter, then a test of the bearish 50-Simple Moving Average (SMA) at $1818 could be inevitable.
However, with the Relative Strength Index (RSI) still lying below the midline, the bullish potential is likely to remain limited.
On the flip side, a breach of the 21-SMA at $1779 would expose the rising trendline support at $1776.
A downside breakout from the triangle could open floors towards the previous week’s low of $1766.
The last line in the sand for gold buyers is seen at the previous week’s low of $1761.
Author

Dhwani Mehta
FXStreet
Residing in Mumbai (India), Dhwani is a Senior Analyst and Manager of the Asian session at FXStreet. She has over 10 years of experience in analyzing and covering the global financial markets, with specialization in Forex and commodities markets.


