Gold Price Forecast: XAU/USD trades below $2,900 despite persistent risk aversion

XAU/USD Current price: $2,892.16
- The United States will publish February Consumer Price Index figures this week.
- The Bank of Canada will announce its decision on monetary policy next Wednesday.
- XAU/USD turned bearish in the near term, could extend its slide in the upcoming sessions.
Spot Gold trades with a softer tone on Monday, piercing the $2,900 mark during American trading hours, albeit confined to familiar levels for a fifth consecutive day. The US Dollar (USD) found near-term demand despite a risk-averse environment. Global stock markets trade in the red at the beginning of the week, maintaining the focus on United States (US) President Donald Trump’s trade war.
The absence of relevant macroeconomic news fueled sentiment-related trading, albeit prevalent demand for safety kept XAU/USD between a rock and a hard place. Later in the week, the US will publish February Consumer Price Index (CPI) figures, with inflation foreseen easing modestly from January levels but still holding above the Federal Reserve’s (Fed) 2% goal.
Other than that, the Bank of Canada (BoC) will announce its decision on monetary policy on Wednesday. The BoC is widely anticipated to trim interest rates by 25 basis points (bps), to 2.75%, moving one step closer to the neutral rate.
XAU/USD short-term technical outlook
From a technical point of view, the daily chart for XAU/USD shows the bright metal remains below a now flat 20 Simple Moving Average (SMA), providing dynamic resistance at around $2,910.00. The longer moving averages keep heading north far below the current level, suggesting bulls maintain control in the long run. Technical indicators, in the meantime, turned lower at around their midlines, suggesting the pair may extend its corrective decline before finding fresh buying interest.
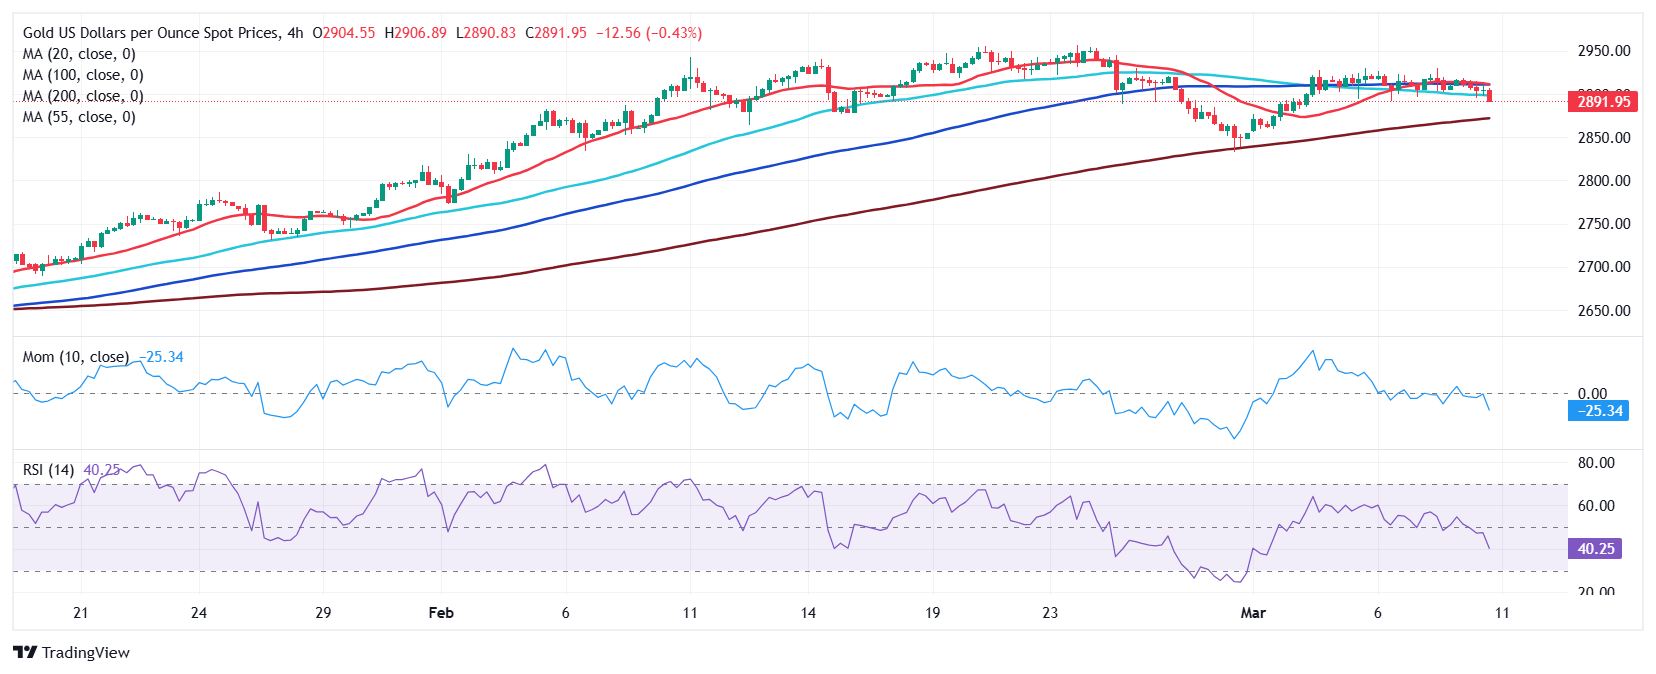
In the near term, and according to the 4-hour chart, the XAU/USD pair is at risk of extending its slide. Converging 20 and 100 SMAs provide resistance in the $2,910 region, while a bullish 200 SMA hovers at around $2,867, providing support. Finally, technical indicators remain within negative levels, although with uneven strength. Still, additional declines are likely on a break below $2,881.80, March 4 intraday low.
Support levels:2,881.80 2,867.10 2,854.95
Resistance levels: 2,910.00 2,927.90 2,941.40
Author

Valeria Bednarik
FXStreet
Valeria Bednarik was born and lives in Buenos Aires, Argentina. Her passion for math and numbers pushed her into studying economics in her younger years.


