Gold Price Forecast: XAU/USD trades around $2,930 amid escalating trade war

XAU/USD Current price: $2,929.08
- Trade war tensions and poor United States data put the USD into sell-off mode.
- The European Central Bank will announce its monetary policy decision on Thursday.
- XAU/USD resumed its advance and aims to retest record highs.
XAU/USD trades near a fresh weekly high of $2,929.65, with higher highs in sight. The bright metal benefited from the broad US Dollar’s (USD) weakness, the latter affected by tepid United States (US) data and President Donald Trump’s massive tariffs on trade partners.
President Trump addressed Congress late on Tuesday and played down the potential negative effects of his latest round of tariffs. “. There'll be a little disturbance, but we're okay with that. It won't be much,” Trump said, adding that reciprocal tariffs on trading partners will come into effect on April 2
Still, US Commerce Secretary Howard Lutnick suggested Trump’s administration may reduce or even roll back tariffs on the two neighbouring countries, spurring risk appetite throughout the first half of the day and harming the USD.
The Greenback fell further after the release of the US ADP Employment Change report, showing that the private sector added 77K new positions in February, much worse than the previous 183K or the expected 140K. The ISM Services Purchasing Managers’ Index (PMI), on the other contrary, jumped to 53.5 in February from 52.8 in the previous month while surpassing expectations of 52.6.
The focus now shifts to the European Central Bank (ECB) expected to deliver another 25 basis points (bps) interest rates cut when it announces its decision on monetary policy on Thursday. Other than that, investors will keep an eye on trade-war developments.
XAU/USD short-term technical outlook
The daily chart for XAU/USD shows it trades around its daily opening, while an intraday dip was quickly reverted, suggesting buyers are taking advantage of dips. The same chart shows Gold develops above all its moving averages, with a flat 20 Simple Moving Average (SMA) providing near-term support at around $2,906.25. Technical indicators, in the meantime, have turned directionless, with the Momentum indicator stuck around its 100 level.
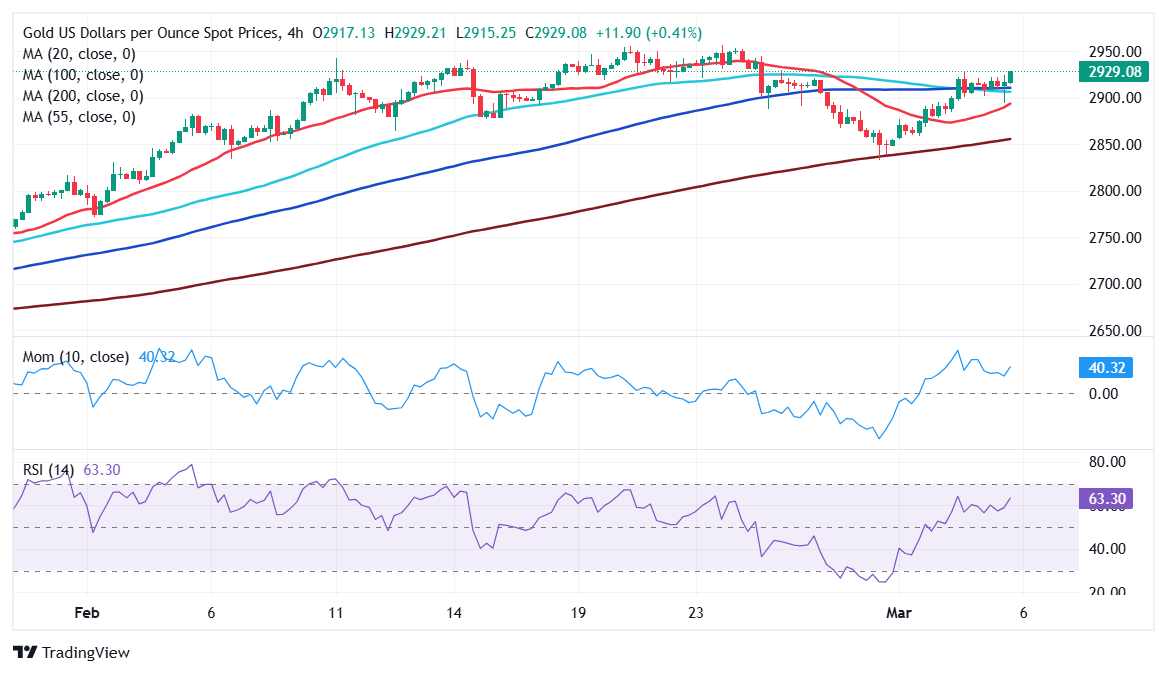
The near-term picture shows the risk skews to the upside. In the 4-hour chart, the XAU/USD pair is holding at the upper end of its recent range while advancing above all its moving averages. A bullish 20 SMA provides intraday support in the $2,890 area while advancing below a still flat 100 SMA. Finally, technical indicators turned firmly north within positive levels, reflecting persistent buying interest.
Support levels: 2,894.25 2,876.90 2,858.70
Resistance levels: 2,927.90 2,941.40 2,956.10
Premium
You have reached your limit of 3 free articles for this month.
Start your subscription and get access to all our original articles.
Author

Valeria Bednarik
FXStreet
Valeria Bednarik was born and lives in Buenos Aires, Argentina. Her passion for math and numbers pushed her into studying economics in her younger years.


