|

Gold Price Forecast: XAU/USD struggles around $2,900 in dull trading

XAU/USD Current price: $2,899.45

  • The US Dollar retains the soft tone seen in the previous week amid tariffs-related concerns.
  • The Federal Open Market Committee will release the Minutes of its latest meeting on Wednesday.
  • XAU/USD trades with a soft tone in the near term, but the downside remains limited.

Spot Gold trades uneventfully at around the $2,900 threshold, as United States (US) markets are closed due to the President’s Day holiday. Canada also celebrates a holiday called Family Day, although banks in some provinces remain open. Nevertheless, market activity is restrained, with choppy action across the FX board.

The US Dollar (USD) retains the weak tone triggered last week by relief headlines, as US President Donald Trump refrained from announcing detailed reciprocal tariffs. At the beginning of the week, President Trump announced levies on all aluminium and steel imports of 25%  and threatened to unveil more taxes later in the week, which he finally did not.

Meanwhile, higher-than-anticipated US inflation reaffirmed the Federal Reserve’s (Fed) hawkishness, adding pressure on the USD. The US macroeconomic calendar includes this week the Federal Open Market Committee (FOMC) Minutes from the January meeting.

XAU/USD short-term technical outlook

From a technical point of view, the XAU/USD pair remains bullish. The daily chart shows that the pair consolidates at the lower end of Friday’s range, yet it also develops above all its moving averages, with a bullish 20 Simple Moving Average (SMA) providing dynamic support at around $2,826. The 100 and 200 SMAs remain far below the shorter one but retain their upward slopes. Technical indicators, in the meantime, retreated from extreme overbought readings but lost their downward strength well into positive levels.

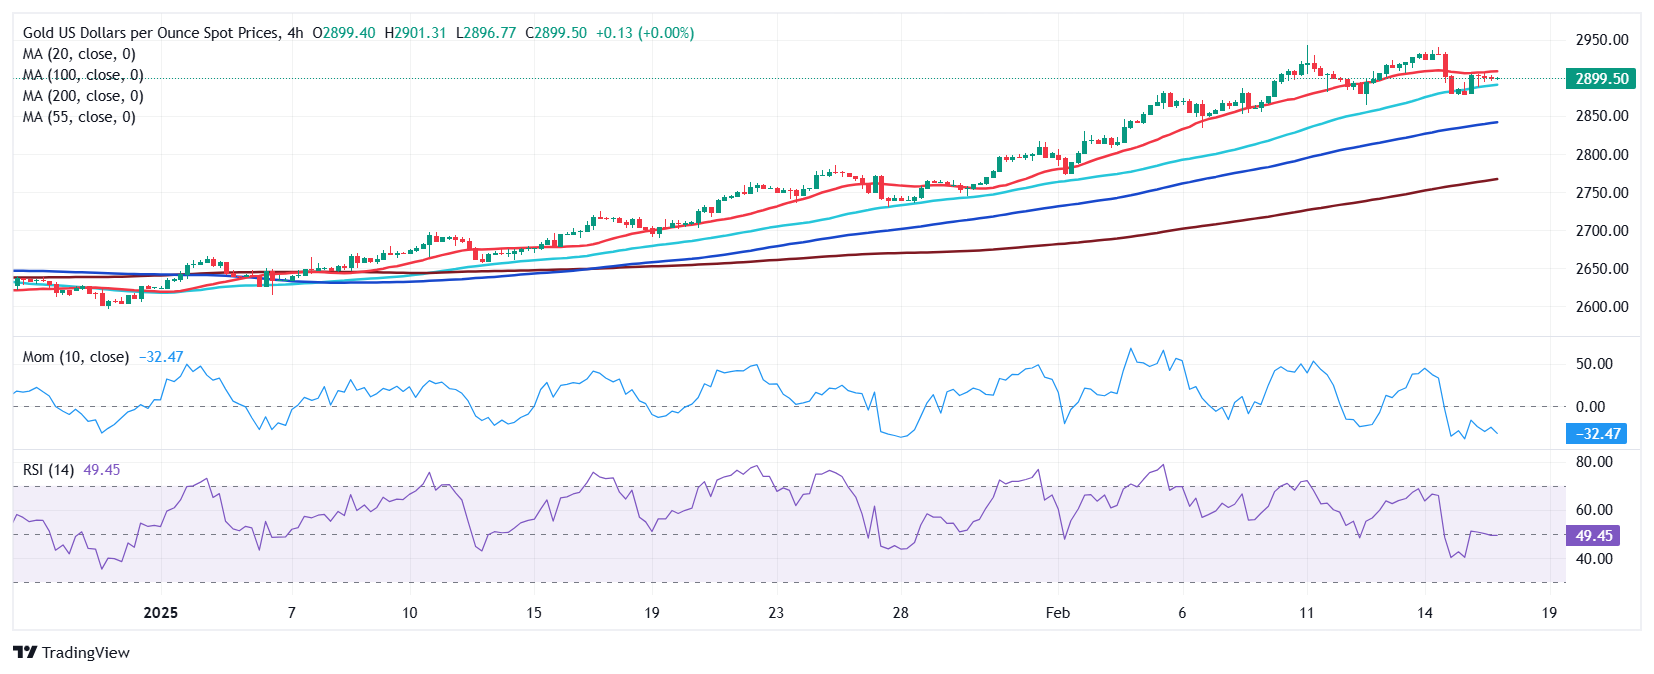
In the near term, and according to the 4-hour chart, however, the XAU/USD pair is neutral-to-bearish. A flat 20 SMA provides immediate resistance at $2,908.10, while technical indicators lack directional strength yet hold below their midlines, suggesting buying interest is scarce. Finally, the 100 and 200 SMAs continue to advance below the current level, but far to become relevant in the near term.

Support levels: 2,889.80 2,876.90 2,863.50

Resistance levels: 2,908.10 2,925.10 2,942.50  

Premium

You have reached your limit of 3 free articles for this month.

Start your subscription and get access to all our original articles.

Subscribe to PremiumSign In

Author

Valeria Bednarik

Valeria Bednarik was born and lives in Buenos Aires, Argentina. Her passion for math and numbers pushed her into studying economics in her younger years.

More from Valeria Bednarik
Share:

Markets move fast. We move first.

Orange Juice Newsletter brings you expert driven insights - not headlines. Every day on your inbox.

By subscribing you agree to our Terms and conditions.

Editor's Picks

EUR/USD edges higher to mid-1.1600s; looks to US PCE Price Index for fresh impetus

The EUR/USD pair attracts some dip-buyers during the Asian session on Friday and recovers a part of the previous day's retracement slide from the 1.1680 region, or the highest level since October 17. Spot prices currently trade around mid-1.1600s and remain on track to register gains for the second straight week.

GBP/USD: Constructive view prevails above 1.3300 ahead of US PCE inflation data

The GBP/USD pair trades on a flat note near 1.3330 during the Asian trading hours on Friday. Traders prefer to wait on the sidelines ahead of the key US inflation report later on Friday. The US delayed Personal Consumption Expenditures Price Index report for September could offer some hints about the US interest rate path.

Gold flat lines above $4,200 mark; looks to US PCE Price Index for some meaningful impetus

Gold struggles to capitalize on the overnight bounce from the $4,175 area, or the vicinity of the weekly trough, and oscillates in a narrow trading range during the Asian session on Friday. Traders now seem reluctant and opt to move to the sidelines ahead of the September Personal Consumption Expenditures Price Index, or the Federal Reserve's preferred inflation gauge. 

Pi Network: Bearish streak nears critical support trendline

Pi Network edges lower on Friday for the third consecutive day, approaching a local support trendline. The on-chain data suggests an increase in supply pressure as Centralized Exchanges experience a surge in inflows. Technically, the pullback in PI risks further losses, as the Moving Average Convergence Divergence indicator is flashing a sell signal. 

Why the Fed may cut rates in December: Understanding the policy shift

The Fed has gone through a noticeable policy swing in recent months - from initiating a rate cut, to signaling a potential pause, and now shifting once again toward another cut in December. This has created understandable confusion among traders and investors trying to interpret the Fed’s reaction function.

XRP edges lower despite record on-chain activity and steady ETF inflows

Ripple is trading under pressure at the time of writing on Thursday, after bulls failed to break the short-term resistance at $2.22. The reversal may extend toward Monday’s low of $1.98, especially if risk-off sentiment persists in the broader cryptocurrency market.