Gold Price Forecast: XAU/USD struggles around $2,400 as concers ease

XAU/USD Current price: $2,404.39
- Concerns about US economic health and Middle East tensions spurred risk aversion.
- Treasury yields fell sharply, pushing the US Dollar up against Gold.
- XAU/USD corrected from a critical support level, but risk is still skewed to the downside.
Risk aversion hit hard financial markets at the beginning of the week, triggering volatile movements across all boards. XAU/USD plummeted to $2,364.19 ahead of Wall Street’s opening, bouncing afterwards to trade around the $2,400 mark at the time of writing, still sharply down on the day. The US Dollar surged against the battered bright metal as concerns about the United States (US) economic performance and escalating tensions in the Middle East put markets in panic mode.
On the one hand, US growth and employment-related data released last week triggered alarms about a potential recession in the world’s largest economy, up to the point that speculative interest began considering an out-of-schedule interest rate cut in the upcoming days. On the other, airstrikes between Israel and the Palestinian Hamas group led to multiple deaths over the weekend, particularly hitting schools and hospitals. Menaces of retaliation came from both sides, spurring concerns they would fall into an all-out war.
Stock markets plummeted in Asia, with the Nikkei 225 having its second-worst day ever. European and American indexes also edged lower, although things stabilized after the US released the ISM Services PMI, which surged in July to 51.4 after posting 48.8 in June. The reading also surpassed the expected 51, pouring some cold water on market concerns.
Helping Gold, government bond yields trimmed early losses after the US opening. The 10-year note Treasury yield fell to its lowest in a year, backing the case for a XAU/USD slide. The note offered as low as 3.66%, with the latter recovery towards the current 3.78% level supporting the current intraday bounce.
XAU/USD short-term technical outlook
The daily chart for XAU/USD shows the pair met buyers around the 61.8% Fibonacci retracement of its June/July rally at around $2,366, a critical support area. However, technical indicators keep heading south, reflecting continued selling interest. Even further, the pair is developing below the 38.2% retracement of the aforementioned rally and a still bullish 20 Simple Moving Average (SMA), both located around $2,411.20.
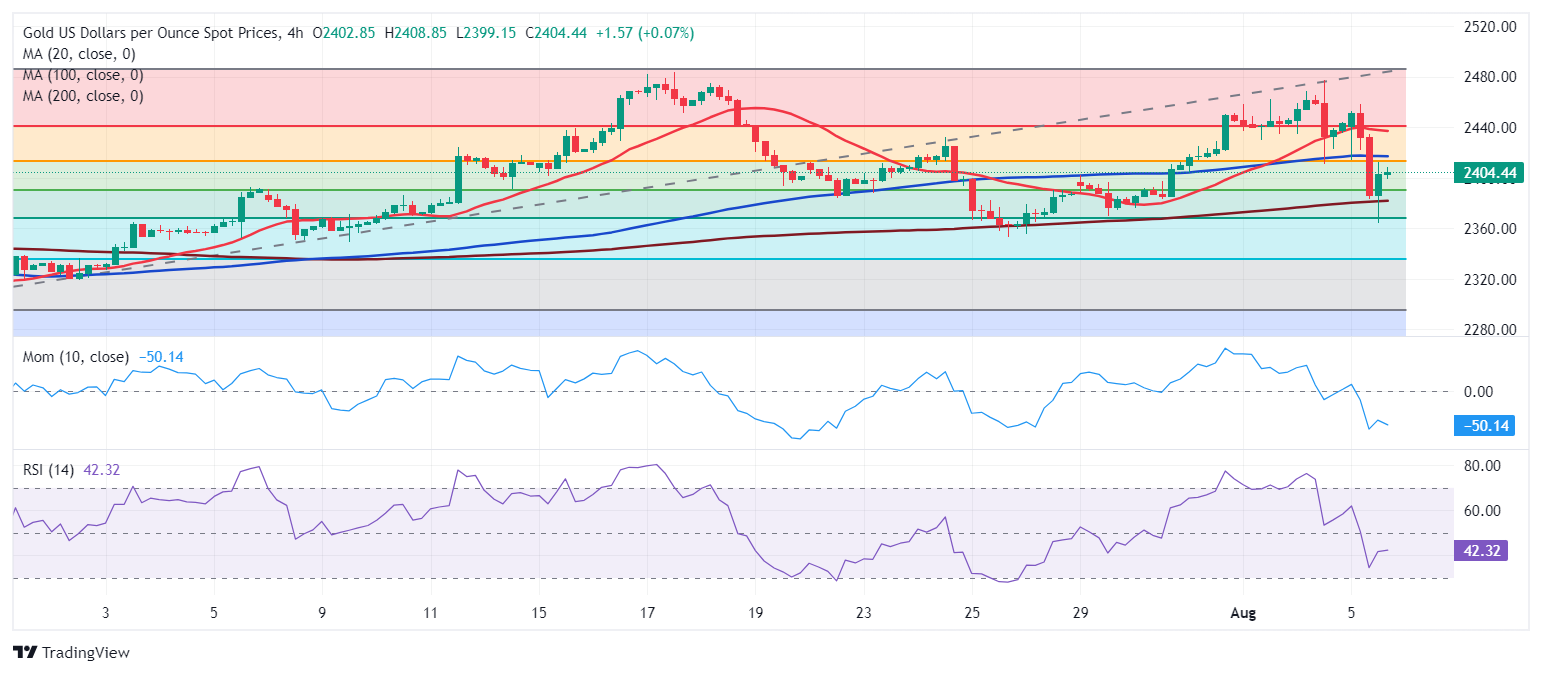
In the near term, and according to the 4-hour chart, the case for a continued advance seems limited. Technical indicators have lost their ascendant strength below their midlines and after correcting oversold conditions, skewing the risk back to the downside. At the same time, the pair trades below the 20 and 100 SMAs, with the shorter one gaining downward traction, supporting the case for another leg south.
Support levels: 2,388.70 2,372.90 2,366.00
Resistance levels: 2,411.20 2,424.10 2,438.80
Premium
You have reached your limit of 3 free articles for this month.
Start your subscription and get access to all our original articles.
Author

Valeria Bednarik
FXStreet
Valeria Bednarik was born and lives in Buenos Aires, Argentina. Her passion for math and numbers pushed her into studying economics in her younger years.


