911 million shares freed: Why SpaceX rallied into its own supply

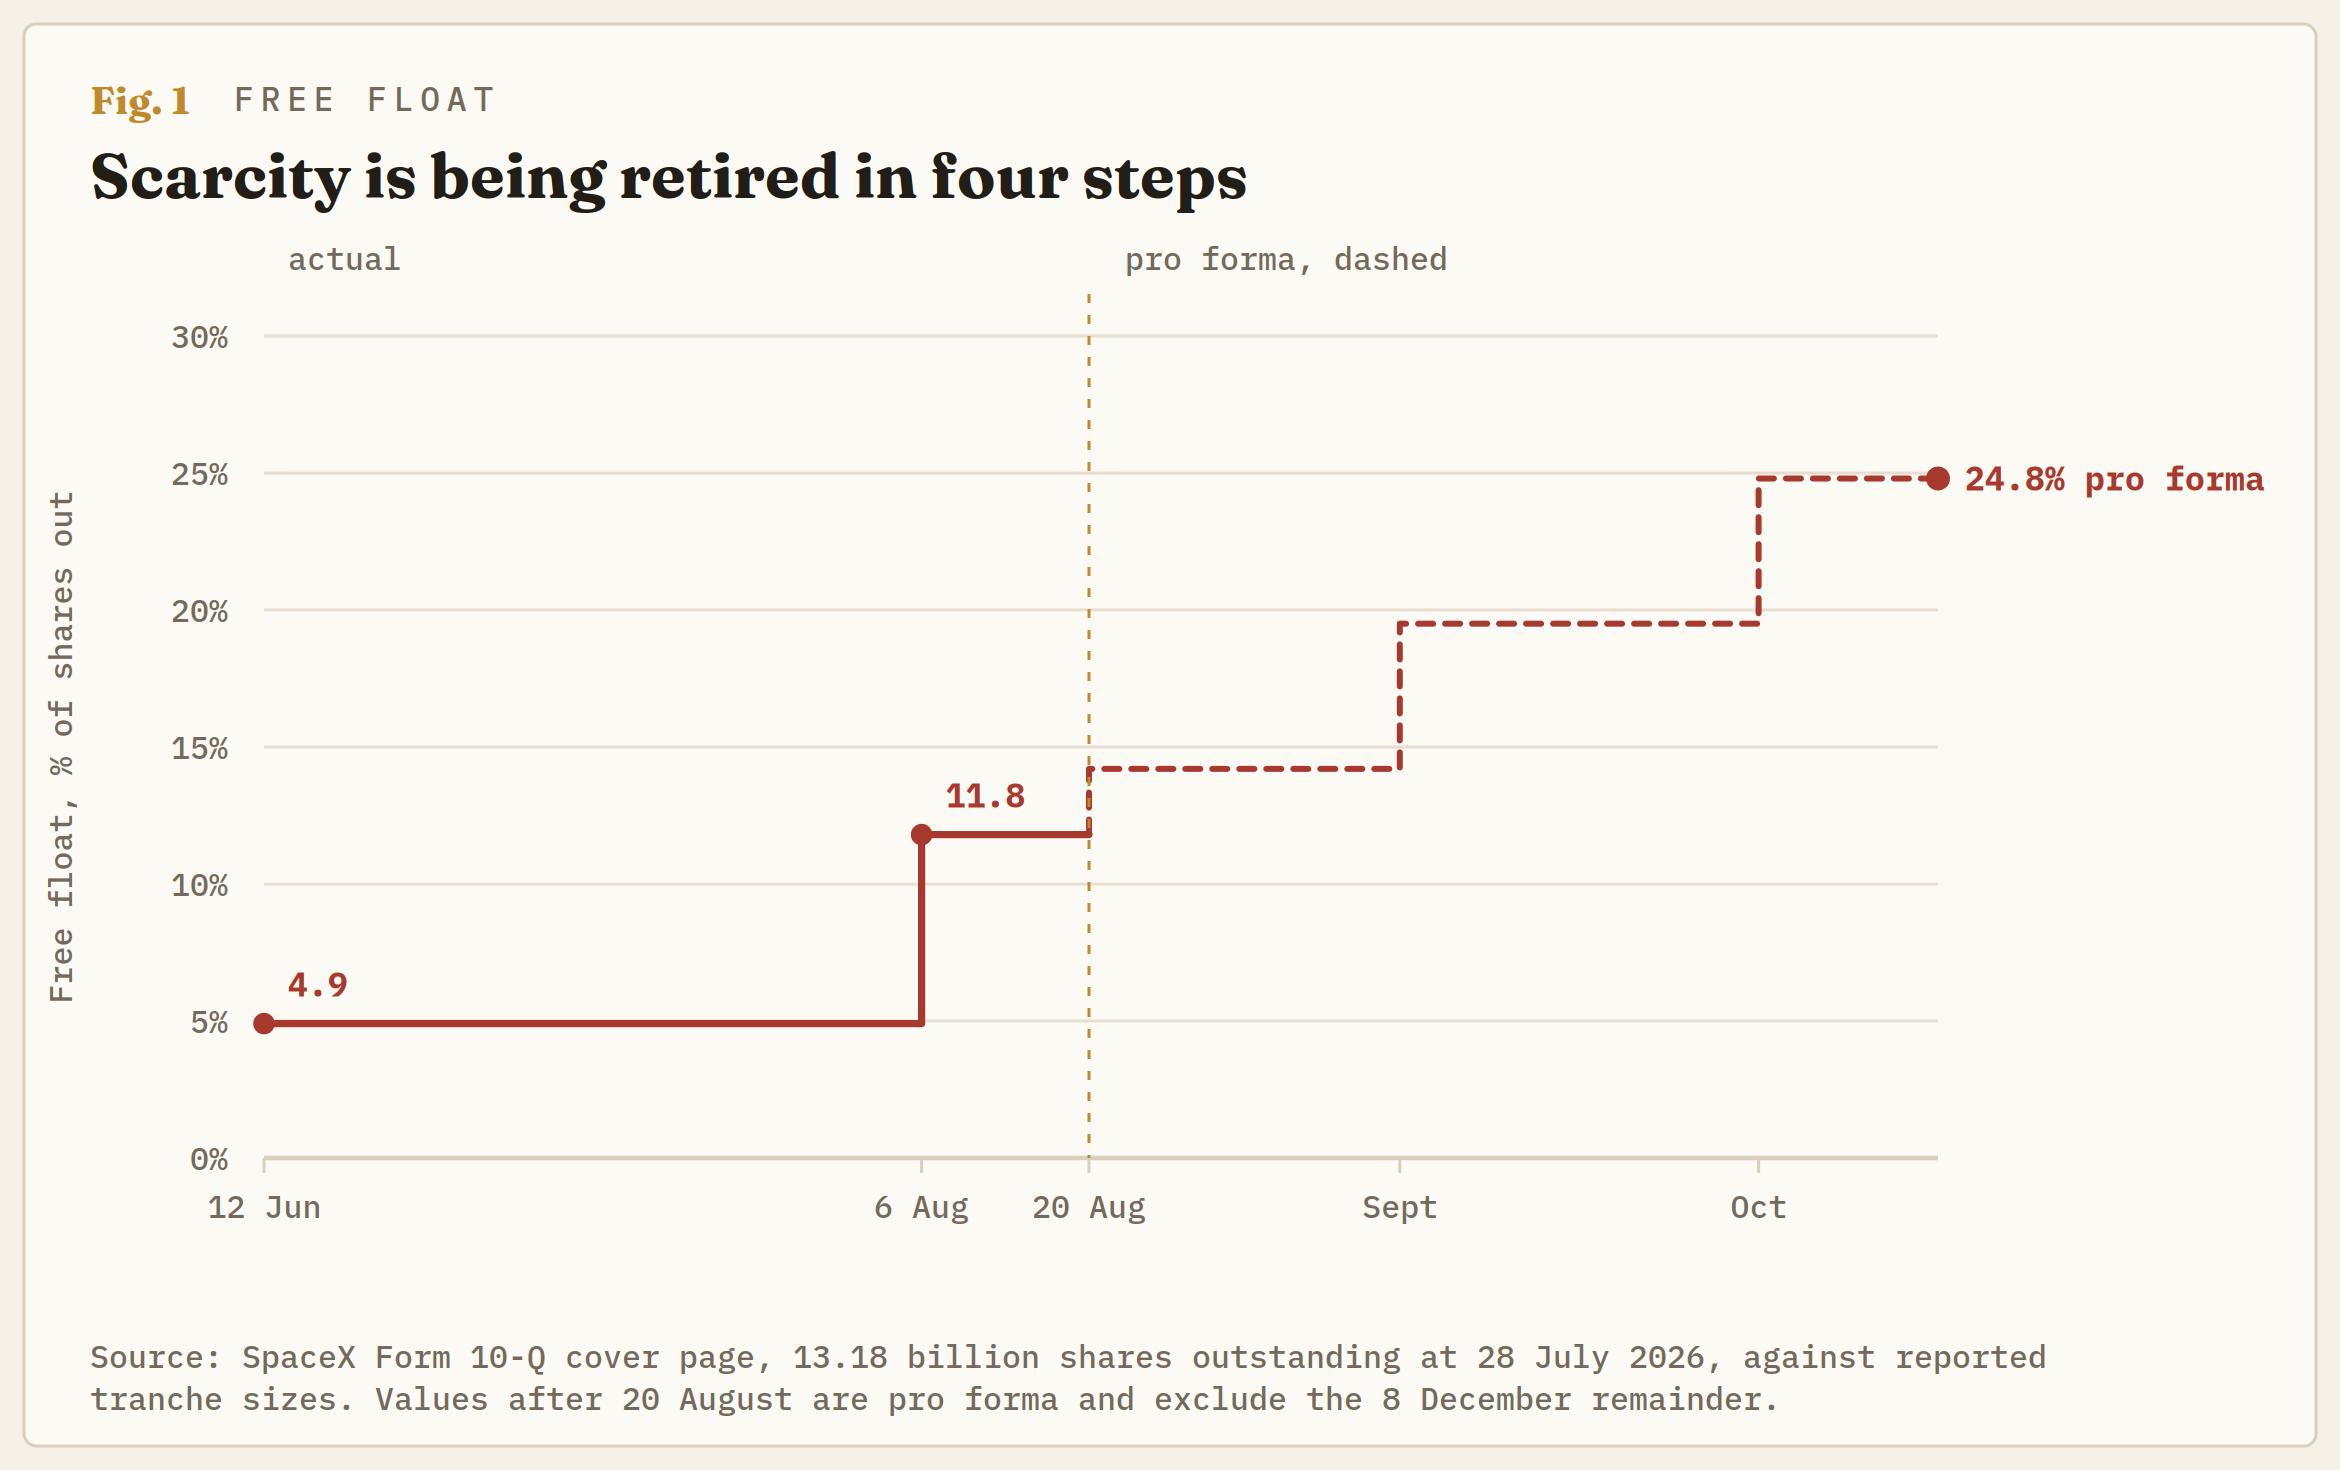
The most heavily trailed supply event of the year landed on August 6, and the SpaceX (SPCX) stock went up. Roughly 911.5 million shares held by insiders and early backers became eligible to trade, around 43% more than the entire float sold at the listing, and the freely tradable portion of the company jumped from under 5% of shares outstanding to nearly 12% in a single session. Every wire had flagged the date for weeks. The shares rose on the day and kept rising for three more.
That is not a market absorbing supply gracefully. It is a market that had already done its selling, and the distinction matters, because it dates the distribution to a stretch when most of the people selling did not own the shares.
The selling happened before the shares were free
The Elon Musk-founded SpaceX priced its initial public offering (IPO) at $135 a share in June, selling 638.9 million Class A shares including the full exercise of the over-allotment and raising net proceeds of $85.7 billion after $575 million of commissions and offering costs. Those are the filing's numbers, not an estimate, and they settle a wire figure that has been circulating at roughly $75 billion since June.
What followed was a fortnight of enthusiasm and eight weeks of grinding retreat. The shares ran to roughly $225 in the week after listing, some 67% above the offer, then spent the rest of the summer giving it back. The stock has not posted a close above the offer price since July 16. On August 5, the session after the first quarterly report as a public company, it printed a low near $105, more than 20% beneath the price at which it had been sold seven weeks earlier.
Now hold that against the float. Fewer than one share in twenty was available to trade through that entire decline. A company valued in the trillions had a tradable base smaller than plenty of mid-caps, and into it walked a short base that reportedly built to roughly a third of the public float, a figure that circulated widely enough to become part of the trade without ever being pinned to a dated disclosure.
Put those two facts side by side and the summer stops looking like a repricing. On a float that small, sustained selling pressure of that duration cannot mostly be holders leaving, because there were barely any holders to leave. It was, in large part, people selling shares they had borrowed, in anticipation of an event nine weeks away that everyone could read in the prospectus.
The offer price is doing the job a moving average usually does
There is no 200-day exponential moving average on this chart, because there have not been 200 days. The 50-day is barely formed and carries almost no information. Strip those away and the price everyone in the stock actually shares is $135, the number printed on the offering.
Tuesday's tape shows what happens when a market runs at that line with no fresh information. The shares opened above $138, pushed to just short of the $140 handle, and have given the move back to trade near $132, down roughly 4.7% on the session with no company news attached to the decline. Monday's range straddled the same area. Two sessions of trying to live above the offer price have produced two sessions of failing to.
Add up the round trip and the arithmetic is unkind in an interesting way. Anyone who bought at the offer is roughly flat after two months. Anyone who bought the June high is down more than 40%. Anyone who shorted into the lock-up and covered on the unlock has had the best trade in the name. The rally off the August low runs to roughly a third, and it has bought the stock a position hovering around the price it was sold for.
That is the tell. A move driven by buyers re-underwriting the business would not care where the offering was priced. A move driven by people closing a position cares enormously, because the offer is where the trade started.
What the filing says that the tape does not
The quarterly report carries a detail that has gone unremarked, and it sits on the cover page rather than in the financial statements.
As of July 28, the company had 7,696,293,669 Class A shares and 5,485,486,276 Class B shares outstanding, a little over 13.18 billion in total. Four weeks earlier, at the June 30 balance sheet date, the split was 7,607 million Class A and 5,569 million Class B. Class B fell by roughly 84 million shares over those four weeks. Class A rose by roughly 89 million.
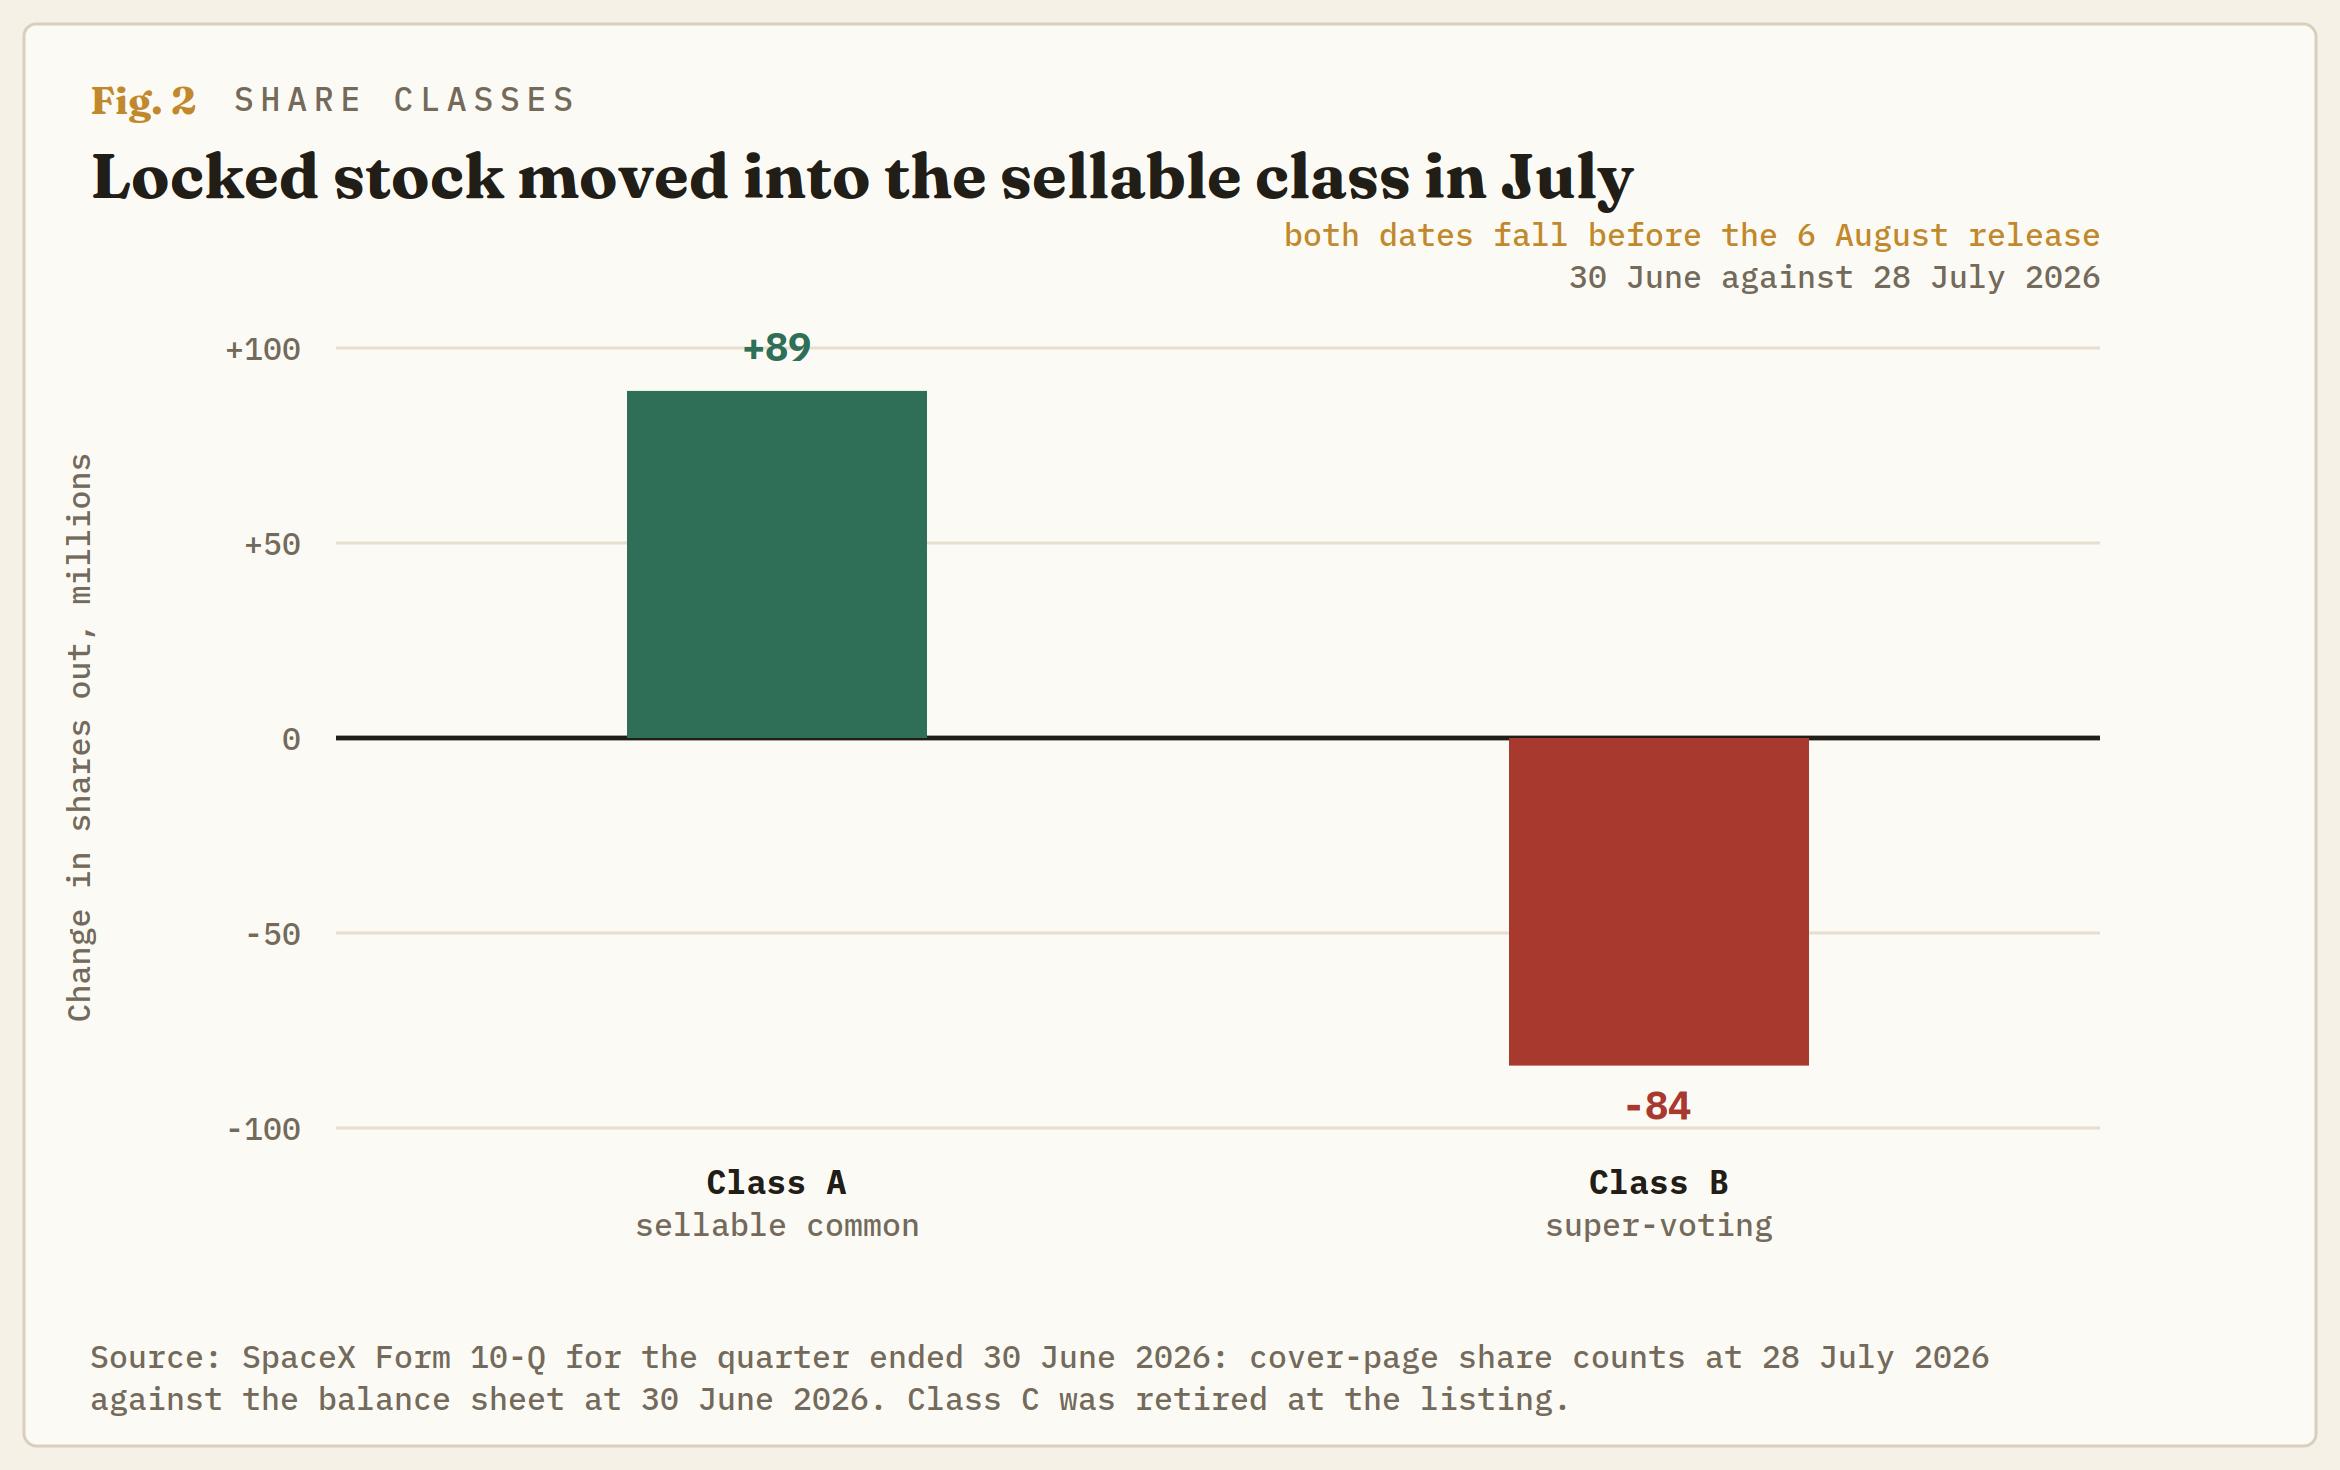
Super-voting stock does not convert into ordinary stock by accident, and it does not convert for reasons unconnected to liquidity. Both dates fall before the release window opened. Whatever the tape was doing in late July, part of the holder base was quietly moving shares into the class that can be sold, and doing it in the weeks when the consensus view held that a wall of supply was about to arrive.
That is not evidence of imminent selling. Conversion is a precondition for it, not a commitment to it, and the shares in question are a rounding error against the release schedule. But it is the only hard, dated, filing-sourced signal of holder intent available before the unlock, and it points the same way as the price action rather than against it.
Two further filing details are worth pinning now. The company effected a five-for-one forward split in May, so every share and per-share figure in circulation has been retroactively adjusted for it. And the quarter-end balance sheet carried cash and marketable securities of roughly $101 billion against a backlog above $47 billion, which is the plainest available answer to the question of whether anybody in this capital arrangement is a forced seller. Nobody is.
Nine days to the next one
Here is the part the coverage has largely skipped in its relief that August 6 passed without incident. That release was not the supply event. It was the first of them.
The company adopted a staggered release plan rather than the conventional single 180-day cliff, and the calendar runs on. Roughly 319 million further shares free on August 20, around 700 million in September and close to that again in October, before the remaining 180-day shares release on December 8. Certain investors run on an extended schedule into 2027, and the founder's block, the 5.5 billion Class B shares discussed above, stays locked until June 2027.
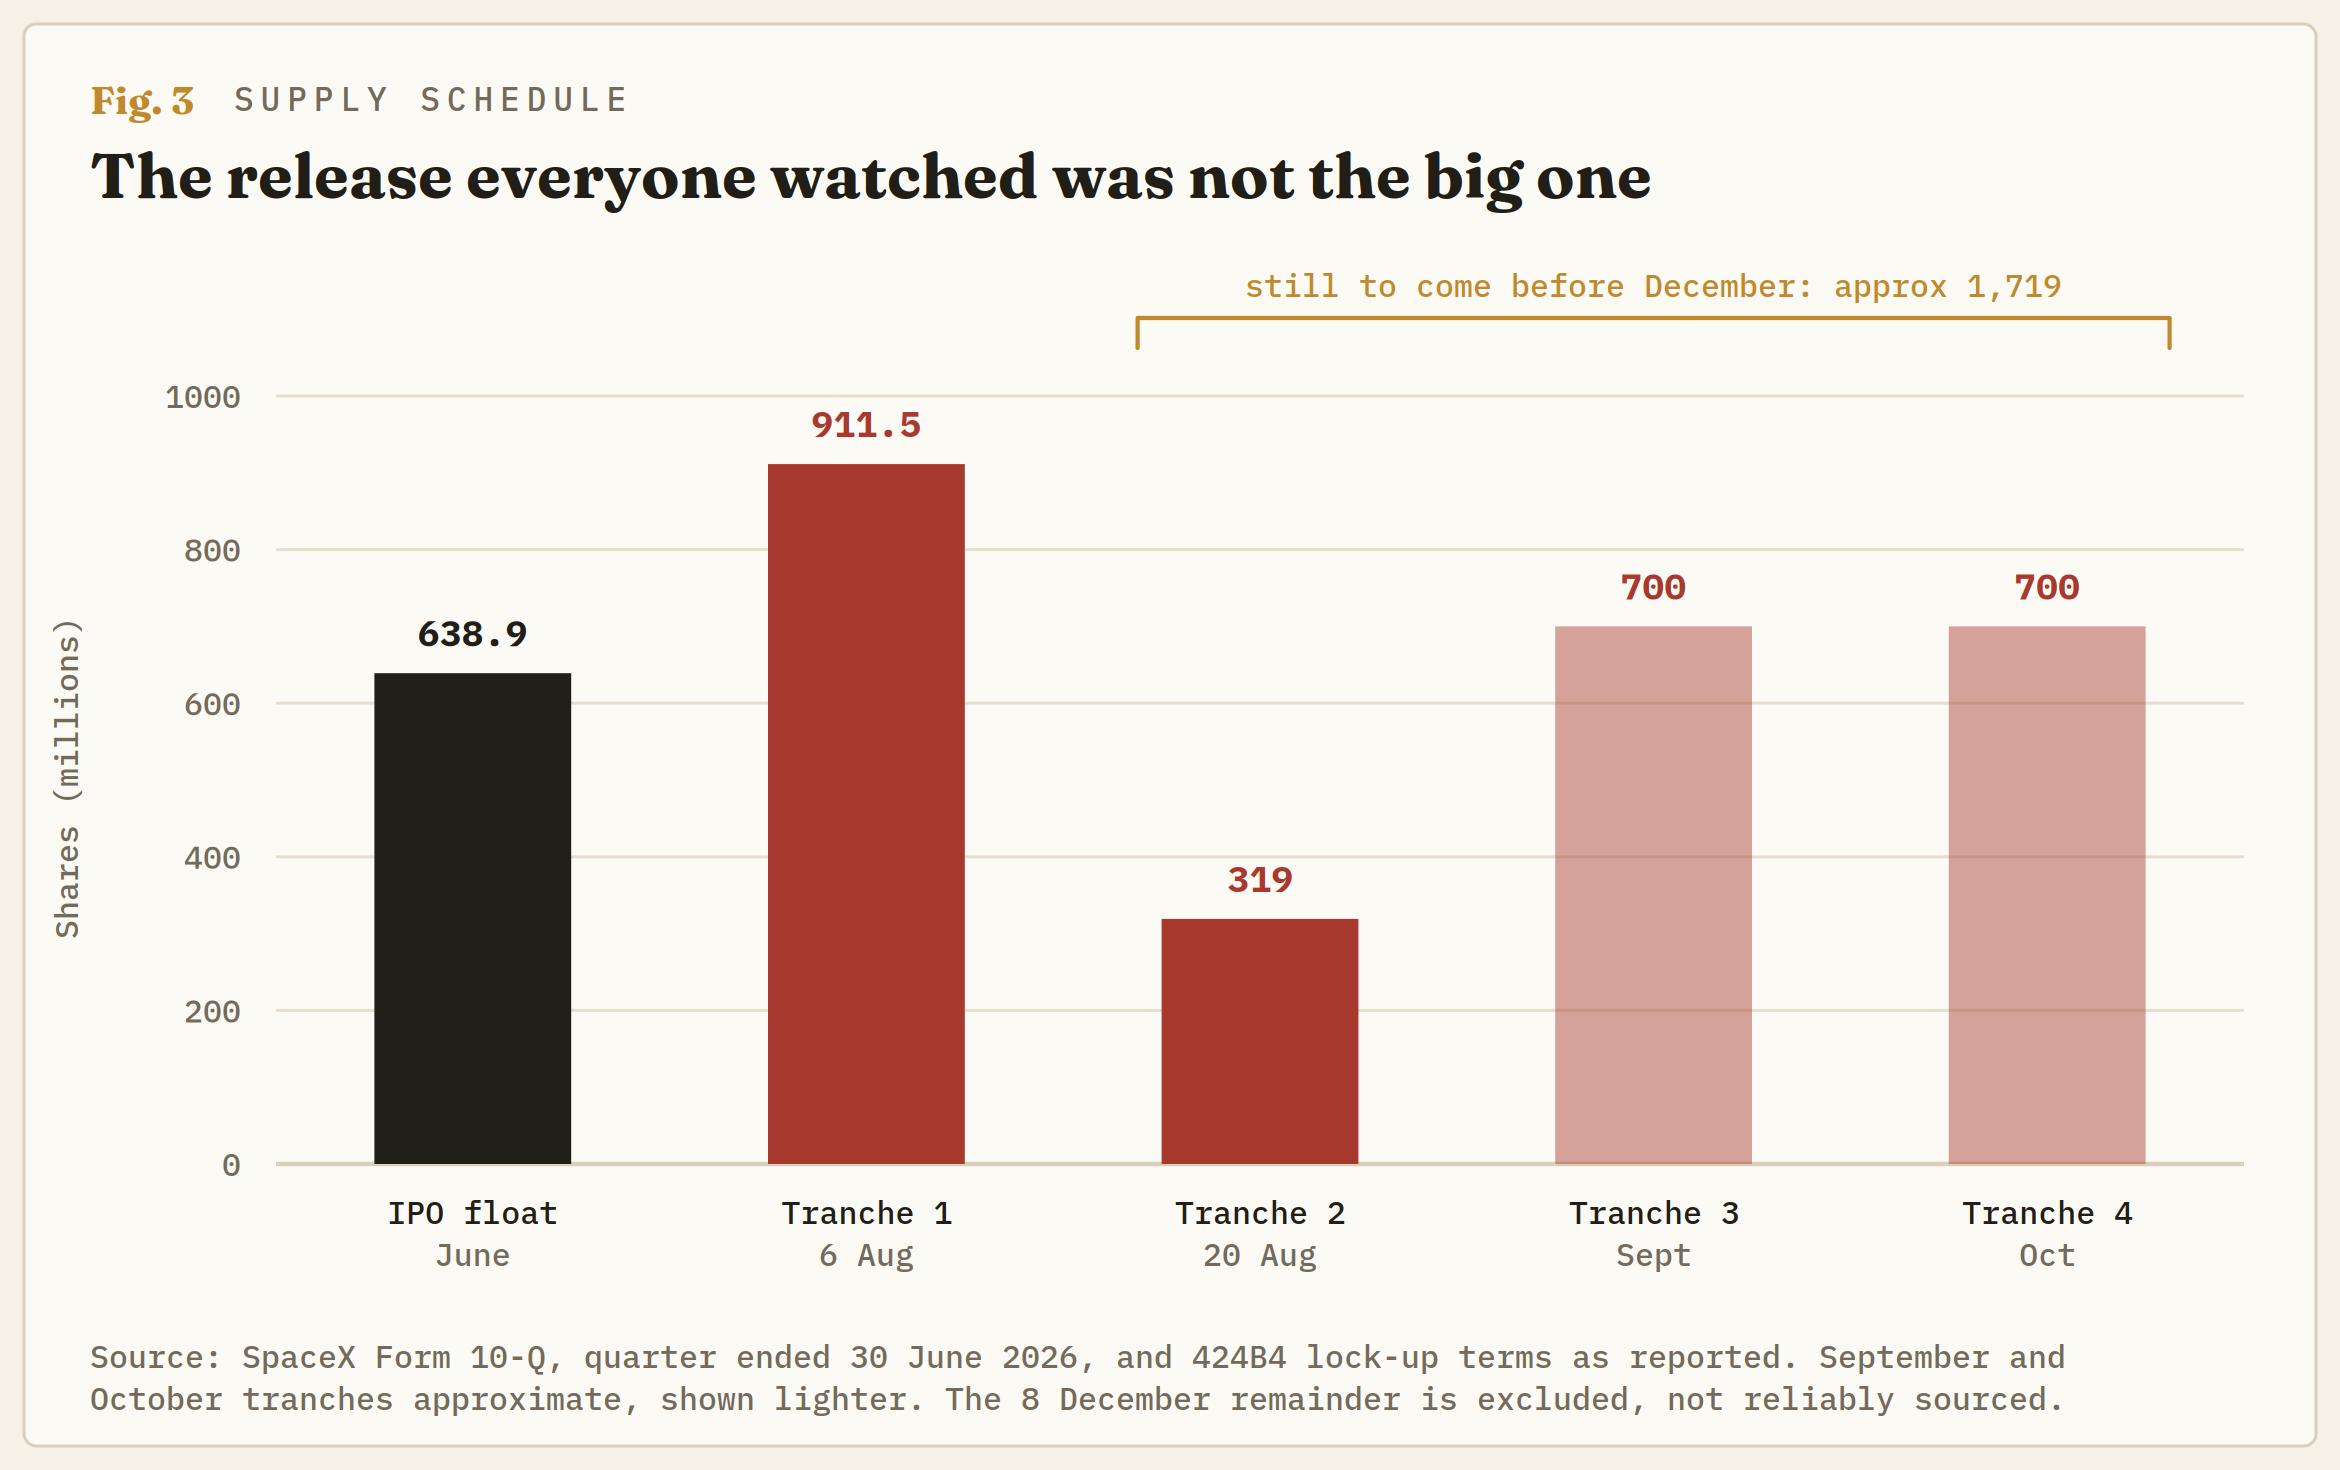
Cumulatively, what is still to come dwarfs what has already arrived. The market has drawn a conclusion about supply from the smallest test on the calendar.
One provision has already been resolved, and resolved cleanly. The terms carried a booster clause freeing an additional 10% of the pool early if the shares traded 30% above the offer for five of the ten sessions into the first earnings report. That condition needed roughly $175 and the stock was more than 20% below the offer when the window ran. It did not fire. The reflexive trap that a rally into earnings would arm its own supply is dead for this cycle, and it died the only way it could, by the shares being too weak to spring it.
The framework from here
The offer price is the line in the sand, and it is unusual to be able to say that about a level with no technical content whatsoever.
Holding above $135 on a closing basis keeps the front-run reading intact and makes the August 20 tranche a supply event to be faded rather than feared, on the argument that a market which absorbed 911 million shares will not be troubled by a third of that number. Losing it, which is where Tuesday's tape currently sits, says the covering has run its course and the stock is back to trading on its own merits, at which point the August low near $105 is the reference and the September and October tranches arrive into a market with nobody left to squeeze.
Watch borrow rates and short interest into next week rather than the price. If the short base has genuinely been retired, the next release lands in a very different market from the last one, and the cushion that turned August 6 into a rally will not be there. Watch the class balances at the next filing too, because the conversion trickle either continues or it does not.
The supply question, the one that has dominated this name since the day it listed, has now been half answered. The market can take the shares. Whether it wants them at this price is a different question, and it turns on what the company is spending, which is a matter for Thursday.
Author

Joshua Gibson
FXStreet
Joshua joins the FXStreet team as an Economics and Finance double major from Vancouver Island University with twelve years' experience as an independent trader focusing on technical analysis.
















