Gold Price Forecast: XAU/USD steadily marching towards $4,000

XAU/USD Current price: $3,870.97
- The United States government ran out of funding, data releases delays.
- The ADP Employment Change report came in much worse than anticipated in September.
- XAU/USD retreats from record highs, retains the bullish bias.
Spot Gold peaked at $3,895.29 on Wednesday, a fresh all-time high. The bright metal rallied on news that the United States (US) government effectively shut down on Wednesday, as Congress was unable to agree on a funding bill. The US Dollar (USD) fell against all major rivals, with safe-haven assets benefiting the most.
Republicans and Democrats have different views on how to re-fund the federal government, and the irreconcilable differences persist. Mid-Wednesday, the Senate voted once again not to advance the Democratic-backed resolution to fund the government for a few weeks.
Meanwhile, US data was mixed. On the one hand, ADP released the Employment Change report, which showed the private sector lost 32,000 job positions in September, much worse than the 50,000 gain anticipated by market participants. The report also reported a 3,000 position loss in August, downwardly revised from a previously reported 54,000 increase.
On the other hand, the ISM Manufacturing Purchasing Managers’ Index (PMI) came in slightly better than anticipated, printing at 49.1 in September vs expectations of 49 and the previous 48.7.
The dismal mood eased after Wall Street’s opening, as stocks shrugged off concerns. The three major indexes trade in the green, weighing on the bright metal. The XAU/USD pair also retreated on modest USD demand.
Most of the US data scheduled for the rest of the risk will hardly see the light if the shutdown persists. In such a scenario, then, Gold is likely to remain attractive and challenge the $4,000 mark.
XAU/USD short-term technical outlook
XAU/USD trades around $3,870, and technical readings in the daily chart show that it keeps posting higher highs, in line with the dominant bullish trend. The Relative Strength Index (RSI) remains at extreme readings, ticking marginally higher at around 81 but mostly flat. The Momentum indicator, in the meantime, resumed its advance above its 100 line, with plenty of room to advance. Finally, the pair keeps rallying above all bullish moving averages, with the nearest being the 20 Simple Moving Average (SMA), currently at $3,699.
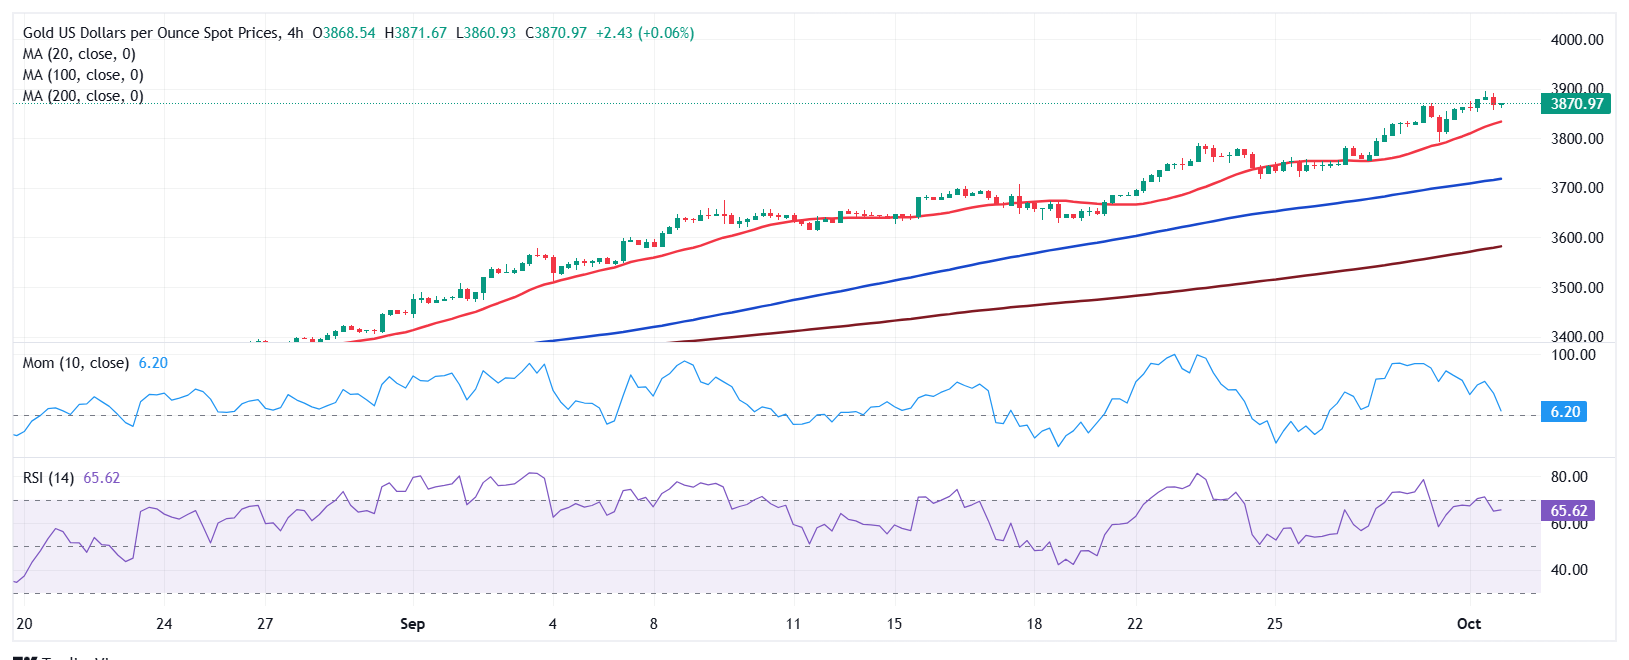
The 4-hour chart shows XAU/USD has corrected overbought readings, while the risk remains skewed to the upside. The RSI indicator turned flat after easing sub-70, while the Momentum indicator still aims south, although well above its 100 line while losing downward steam. Finally, moving averages maintain their upward slopes well below the current level, with the 20 SMA providing support at around $3,828.
Support levels: 3,853.25 3,828.00 3,807.05
Resistance levels: 3,895.00 3,910.00 3,930.00
Author

Valeria Bednarik
FXStreet
Valeria Bednarik was born and lives in Buenos Aires, Argentina. Her passion for math and numbers pushed her into studying economics in her younger years.


