Gold Price Forecast: XAU/USD slowly but steadily approaching $2,800

XAU/USD Current price: $2,786.10
- United States data confirmed the country’s economic resilience.
- Focus on the US presidential election and the Federal Reserve’s decision next week.
- XAU/USD retains its bullish strength despite overbought, $2,800 at sight.
Gold traded as high as $2,789.72 a troy ounce on Wednesday, a fresh record high. XAU/USD retreated after Wall Street’s opening but met buyers at around $2,770 and approaches the aforementioned high en route to unexplored territory.
The US Dollar (USD) reacted positively to the first batch of United States (US) data, surging after an upbeat ADP report on private job creation showed the sector added 233K new positions in October, much better than the 115K expected. The Greenback retained its strength following the release of the Q3 Gross Domestic Product (GDP) preliminary estimate, showing that the economy grew at an annualized pace of 2.8%, below the 3% expected and the previous, yet still far from concerning.
Finally, the US reported an uptick in inflation in the three months to June, as the core Personal Consumption Expenditures (PCE) Price Index rose by 2.2%, easing from the previous 2.8% but above the 2.1% expected.
Employment, growth, and inflation all fell within a tolerable range, resulting in little relevance to the upcoming Federal Reserve’s (Fed) monetary policy decision next week. In the end, market players welcomed the figures. As a result, the USD came under selling pressure while Wall Street trimmed pre-opening losses, and the three major indexes turned positive.
Meanwhile, uncertainty surrounding the outcome of the US presidential election keeps boosting demand for Gold and buyers take their chances on intraday deeps. Demand for Gold will likely continue outpacing that of the USD in risk-averse scenarios, while also gaining when the latter weakens.
The US will release the September PCE Price Index on Thursday, although it may have a limited impact given the quarterly figures just released within the GDP report. On Friday, the country will publish the October Nonfarm Payrolls (NFP) report.
XAU/USD short-term technical outlook
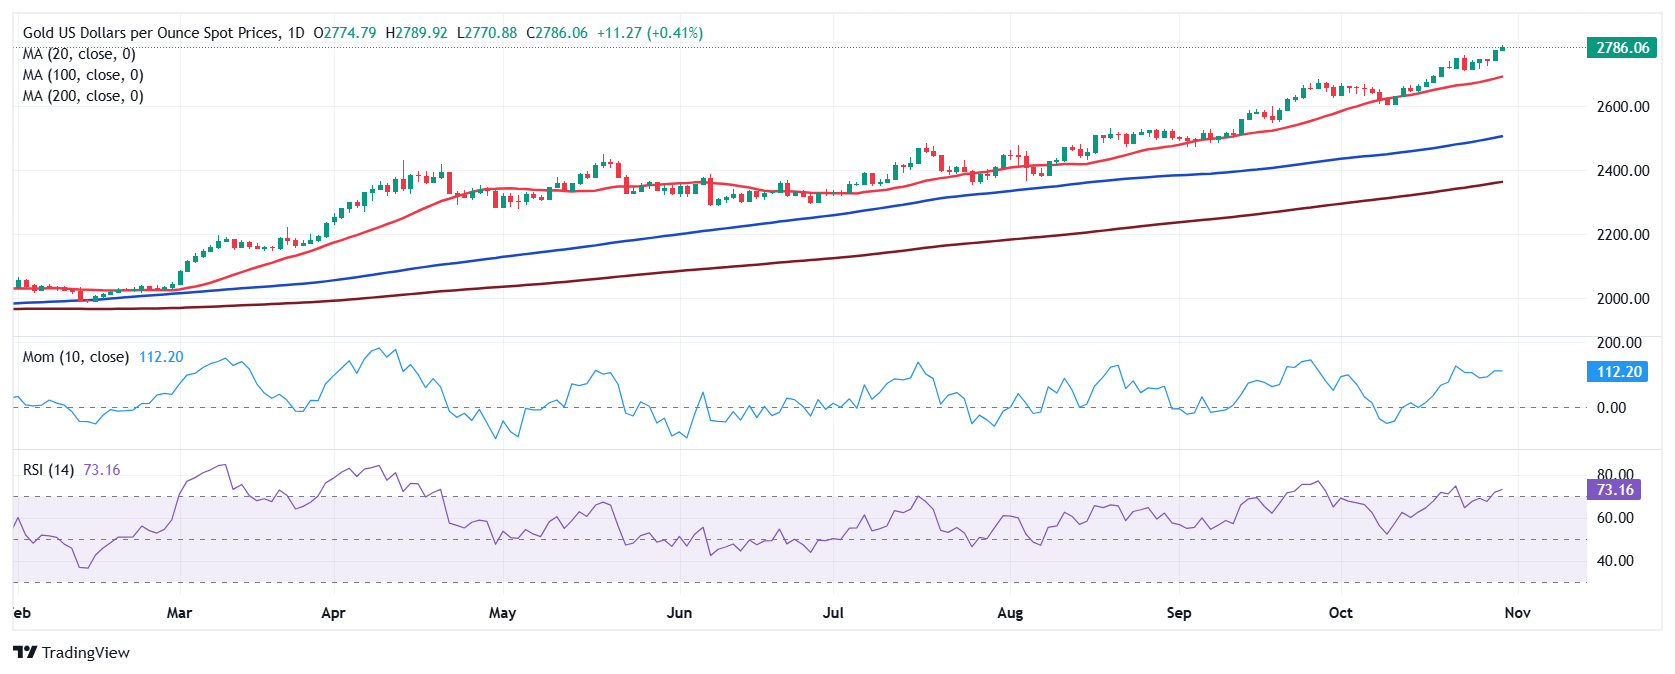
Technically, the daily chart for the XAU/USD pair is bullish despite being overbought. The pair keeps trading above all its moving averages, with the 20 Simple Moving Average (SMA) currently at around $2,691.70. The 100 and 200 SMAs accelerated higher far below the shorter one, reflecting persistent buying interest. Finally, technical indicators entered overbought readings, partially losing their upward strength but far from showing upward exhaustion. Higher highs are still on the docket before a relevant downward correction occurs.
The 4-hour chart indicates a persistently strong upward momentum. Technical indicators resumed their advances in the overbought territory after a modest corrective decline, confirming buyers continue to take their chances on dips. At the same time, the 20 SMA accelerated north far below the current level while above the 100 and 200 SMAs. A bullish continuation beyond $2,800 is on the docket before the US election.
Support levels: 2,770.90 2,757.30 2,742.50
Resistance levels: 2,790.00 2,810.00 2,825.00
Premium
You have reached your limit of 3 free articles for this month.
Start your subscription and get access to all our original articles.
Author

Valeria Bednarik
FXStreet
Valeria Bednarik was born and lives in Buenos Aires, Argentina. Her passion for math and numbers pushed her into studying economics in her younger years.


