Gold Price Forecast: XAU/USD sellers target $1,885 on hot United States inflation data
- Gold price remains vulnerable ahead of the key US inflation data.
- US Dollar rebounds with US Treasury bond yields amid a tepid risk tone.
- Gold price yields a range breakdown, with more downside on the cards.

Gold price is extending the previous decline while heading toward the $1,900 threshold early Wednesday. Gold price has come under renewed selling pressure as the United States Dollar (USD) is attempting a rebound amid a cautious market environment and higher US Treasury bond yields. All eyes stay focused on the all-important US Consumer Price Index (CPI) inflation data, which will help determine the US Federal Reserve’s (Fed) path forward on interest rates.
US Consumer Price Index data in spotlight
Markets remain risk averse on Wednesday, taking cues from a negative close on Wall Street overnight after a decline in Apple and Oracle shares. Investors weigh the renewed hawkish expectations surrounding the European Central Bank (ECB) and Bank of Japan (BoJ) alongside the implications on global economic growth and central banks’ outlook amid the ongoing surge in oil prices. Oil prices are trading close to ten-month highs on OPEC+ cuts-led tightening oil markets.
The US Dollar is finding fresh demand as a safe-haven asset due to risk aversion, exerting downward pressure on Gold price. The US Treasury bond yields are reversing the previous drop on expectations that hot US CPI data will prompt the Fed to deliver another interest rate hike in November or December, as the probability of a September Fed pause is 93%. Therefore, Gold price remains exposed to downside risks below $1,900.
The US CPI is seen rising 3.6% YoY in August, up from a 3.2% clip reported in July. The annual Core CPI inflation is set to fall to 4.3% in the reported month, compared with a 4.7% increase in July. On a monthly basis, US CPI is likely to rise 0.6% in August, while the core figure is expected to hold steady at 0.2%.
On Tuesday, Gold price tumbled after the leaked ECB inflation forecasts ramped up hawkish expectations for the upcoming ECB policy meeting and weighed on the non-interest-bearing bright metal. The buying interest around the Euro gathered steam on the ECB report, driving EUR/USD sharply higher at the expense of the US Dollar. The pullback in the US Dollar helped limit losses in Gold price near $1,907.
Gold price technical analysis: Daily chart
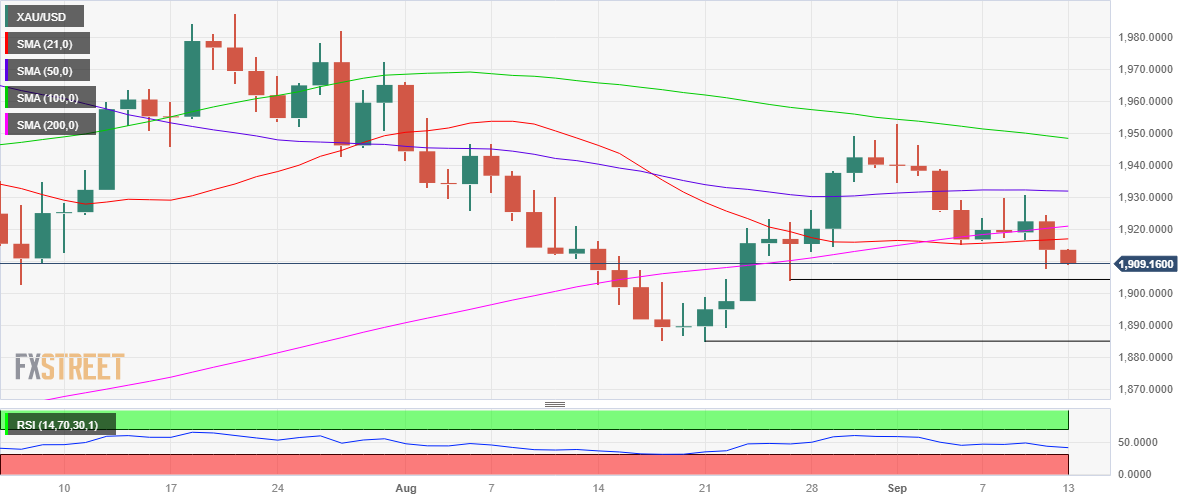
Heading into the US inflation showdown, the path of least resistance for Gold price remains to the downside after it charted a range breakdown on Tuesday.
Gold price ended its consolidation between the horizontal 21- and 50-Daily Moving Averages (DMA) at $1,917 and $1,932, respectively, after closing the day below the former.
The 14-day Relative Strength Index (RSI) is pointing south below the midline, suggesting more room for the downside.
The next significant support for Gold price awaits at the $1,900 threshold, below which a sharp sell-off toward the static support at $1,885 will be in the offing.
Conversely, the immediate resistance is seen at the 21 DMA of $1,917, above which the 200 DMA hurdle at $1,921 will be retested.
Acceptance above the latter will see another run toward the 50 DMA at $1,932.
Premium
You have reached your limit of 3 free articles for this month.
Start your subscription and get access to all our original articles.
Author

Dhwani Mehta
FXStreet
Residing in Mumbai (India), Dhwani is a Senior Analyst and Manager of the Asian session at FXStreet. She has over 10 years of experience in analyzing and covering the global financial markets, with specialization in Forex and commodities markets.


