Gold Price Forecast: XAU/USD sees dip-buying after sell-off, looks to US-China trade updates
- Gold bounces off key support near $4,000 as the profit-taking decline stalls early Wednesday.
- US Dollar reverses Tuesday’s upswing as traders await the US-China trade talks, geopolitical updates.
- Gold’s bullish trend remains intact as the daily RSI remains above the 50 level, despite the recent steep drop.

Gold is attempting a recovery above the $4,100 mark early Wednesday, after having reversed a further sell-off to near the key $4,000 support. Gold buyers fight back control, awaiting fresh developments on the US-China trade front.
Gold was down but not yet out
Gold is licking its wounds following the intense volatility witnessed so far this week.
Having lost over 5% on Tuesday, Gold gave away another $125 in the early Asian trading hours, but bargain hunters quickly jumped in at lower levels, driving the bright metal back to near $4,100 threshold.
Tuesday’s $230 correction was mainly due to profit-taking as the record-setting rally was overdone. Traders resorted to cashing in on their long positions amid easing US-China trade tensions as US President Donald Trump touted a fair deal with China when he meets his counterpart Xi Jinping in South Korea next week.
Meanwhile, markets also eagerly awaited the trade discussions between US Treasury Secretary Scott Bessent and Chinese Vice Premier He Lifeng in Malaysia to de-escalate the renewed trade tensions.
The sell-off in Gold was also sparked by an intense buying wave in the US Dollar (USD), courtesy of a sharp rally in the USD/JPY pair. The Japanese Yen (JPY) faced strong headwinds after Sanae Takaichi was elected as Japan's Prime Minister. An expansionary era in Japan is likely to return, with Takaichi at the top, which weighed on the JPY while boosting USD/JPY.
Looking ahead, all eyes remain on fresh developments surrounding the US-China trade talks, with the US government shutdown still in place and a meeting between Trump and Russian President Vladimir Putin called off.
Gold price technical analysis: Daily chart
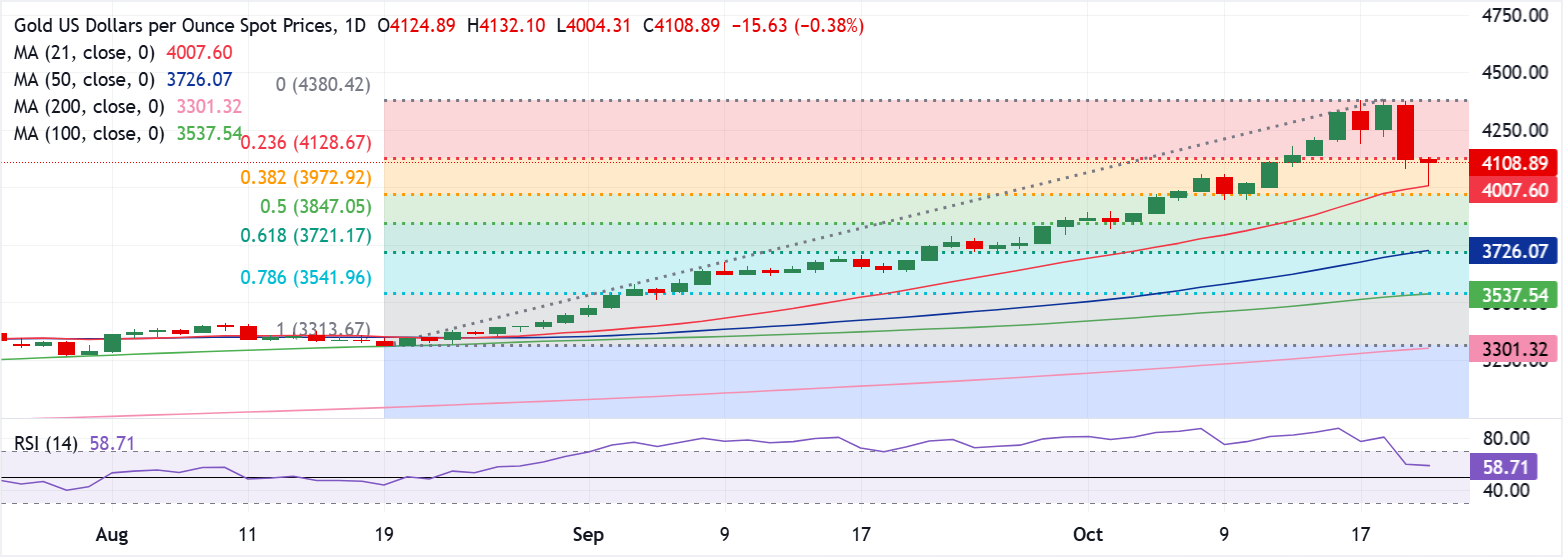
Gold tested the critical support in the area $4,007-$3,973, where the 21-day Simple Moving Average (SMA) and the 38.2% Fibonacci Retracement level of the parabolic rise from mid-August align.
Buyers need to recapture the 23.6% Fibo support-turned-resistance at $4,129 to sustain the rebound toward all-time highs of $4,382.
Ahead of that level, the $4,300 round figure needs to be taken out.
The 14-day Relative Strength Index (RSI) has paused its pullback from the extreme overbought zone to trade near 59, as of writing.
The leading indicator suggests that the longer-term bullish potential in Gold remains intact.
On the flip side, if the aforesaid confluence support zone at around $4,000 gives way, a steeper correction could unfold toward the 50% Fibo level at $3,847.
The line in the sand for Gold buyers is seen at the 61.8% Fibo, the Golden Ratio, at $3,722. The 50-day SMA coincides at that level, making it a powerful downside cap.
Premium
You have reached your limit of 3 free articles for this month.
Start your subscription and get access to all our original articles.
Author

Dhwani Mehta
FXStreet
Residing in Mumbai (India), Dhwani is a Senior Analyst and Manager of the Asian session at FXStreet. She has over 10 years of experience in analyzing and covering the global financial markets, with specialization in Forex and commodities markets.


