Gold Price Forecast: XAU/USD retreats from record highs, maintains the bullish strength

XAU/USD Current price: $2,724.07
- Looming US elections and Middle East tensions push investors into the US Dollar.
- Treasury yields surged in a risk-averse environment and ahead of earnings reports.
- XAU/USD reached $2,740 and retreated, but bulls are not yet done.
Spot Gold keeps reaching record highs on a daily basis, trading as high as $2,740.42, before retreating after Wall Street’s opening. The US Dollar gathered momentum alongside government bond yields as looming United States (US) elections fuel demand for safe-haven assets. According to the latest Washington Post poll, Donald Trump, the Republican candidate and Kamala Harris, the Democratic one, are still virtually tied in the seven key states.
However, there are different polls showing that former President Trump outperforms Vice-president Harris in key matters such as the economy, inflation, and immigration. A Trump victory would mean quite a different scenario, with more taxes and restrictions that could negatively affect inflation and, hence, push the Federal Reserve (Fed) away from the current monetary loosening path. The uncertainty is high three weeks ahead of elections, explaining resurgent bonds demand.
In the meantime, escalating geopolitical tensions in the Middle East further support the USD. Israel launched airstrikes across Lebanon overnight, targeting Hezbollah's financial operations, as reported by local authorities. Israeli Foreign Minister Israel Katz noted: “We will keep striking the Iranian proxy until it collapses,” cooling down hopes for a potential cease-fire.
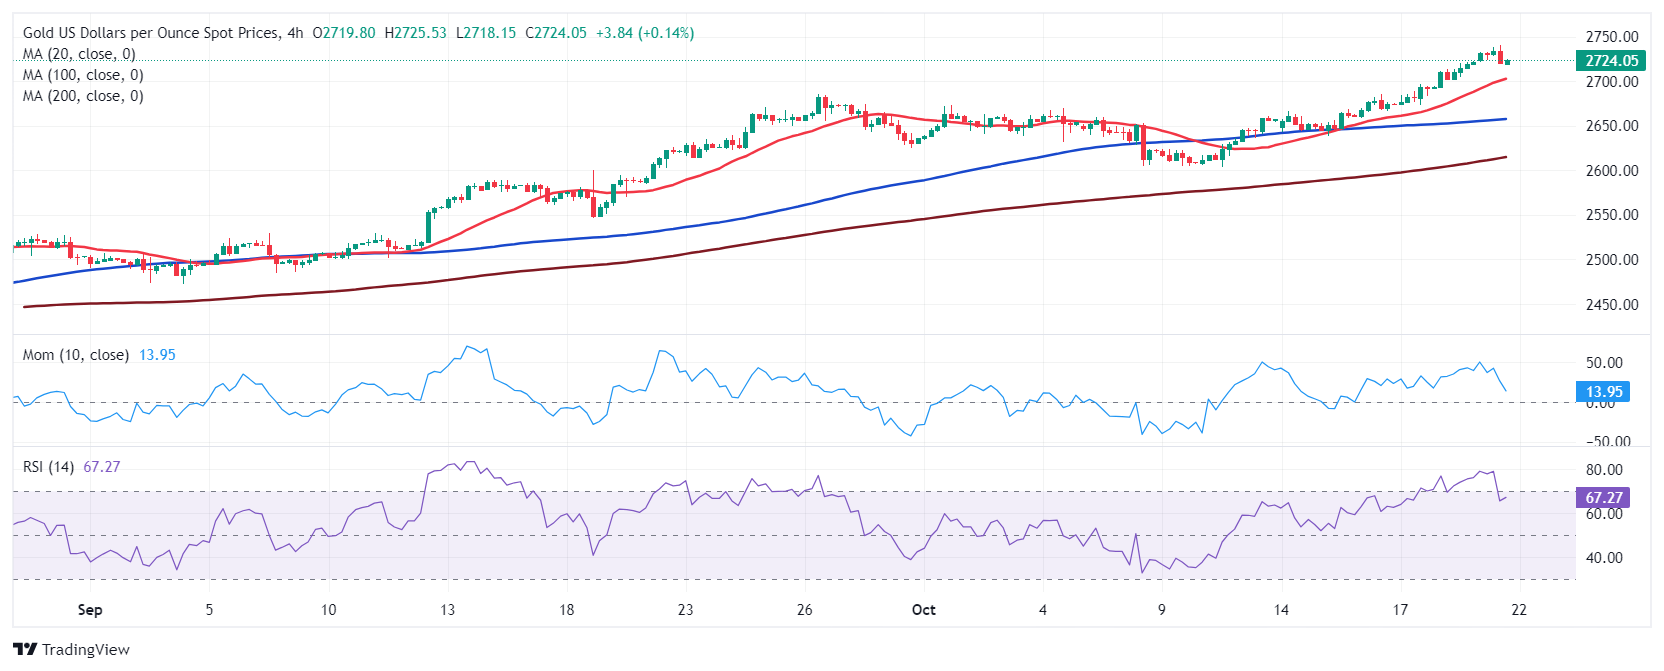
XAU/USD short-term technical outlook
From a technical point of view, the daily chart for XAU/USD shows the risk remains skewed to the upside. The pair develops above bullish moving averages, with the 20 Simple Moving Average (SMA) currently at around $2,660. The Momentum indicator lost its upward strength but holds near its October high, while the Relative Strength Index (RSI) indicator turned directionless at around 72, suggesting receding buying interest.
XAU/USD has corrected extreme overbought conditions in the near term. The 4-hour chart shows technical indicators turning flat after retreating from multi-week peaks, still holding well above their midlines and suggesting buyers have paused yet not given up. The 20 SMA, in the meantime, keeps advancing below the current level while above the 100 and 200 SMAs, in line with the dominant bullish trend.
Support levels: 2,716.40 2,700.00 2,685.45
Resistance levels: 2,740.00 2,755.00 2,770.00
Author

Valeria Bednarik
FXStreet
Valeria Bednarik was born and lives in Buenos Aires, Argentina. Her passion for math and numbers pushed her into studying economics in her younger years.


