Gold Price Forecast: XAU/USD resumes its slide below $3,300

XAU/USD Current price: $3,295.59
- Mounting global trade tensions maintain the US Dollar on the winning side.
- The United States will release the July Nonfarm Payrolls report on Friday.
- XAU/USD could reach lower lows before the end of the week.
The XAU/USD pair bottomed at $3,268.08 on Wednesday, setting a fresh July low after the United States (US) Federal Reserve (Fed) monetary policy decision. The US Dollar (USD) also benefit from upbeat local data indicating the economy grew at a faster-than-anticipated pace in the second quarter of the year, while price pressures in the same period eased.
The USD rally came to a halt in Asia, but the American currency retained most of its gains, barely correcting near-term overbought conditions, helping Gold correct towards the $3,415 price zone, but quickly retraced back below the $3,300 mark amid renewed USD strength.
The Greenback found its footing on a souring market mood amid renewed global trade tensions. As the August 1 deadline looms, trade deals are nowhere to be found. In fact, US President Donald Trump announced massive 50% tariffs on Brazilian imports, and an equal levy on all imports of semi-finished copper products and copper-intensive derivative products on Wednesday. Furthermore, he said that it would be “very hard” to clinch a deal with Canada after the country backed statehood for Palestine.
The week will end with a bang, as the US will publish the July Nonfarm Payrolls (NFP) report. Market players anticipate that the US added 110K new job positions in July, below the 147K gained in June. The Unemployment Rate is expected to have ticked higher, from 4.1% to 4.2%. Additionally, wage inflation, as measured by Average Hourly Earnings, is expected to have risen by 0.3% in the month and by 3.8% from a year earlier, higher than the 0.2% and 3.7% respectively posted in June.
XAU/USD short-term technical outlook
The daily chart for the XAU/USD pair shows it holds on to modest intraday gains in the $3,290 price zone. The same chart shows a bullish 100 Simple Moving Average (SMA) is partially losing its bullish momentum while offering dynamic support at around $3,268.00. The same chart shows the 20 SMA remains flat above the current level, while technical indicators head south with uneven strength within negative levels.
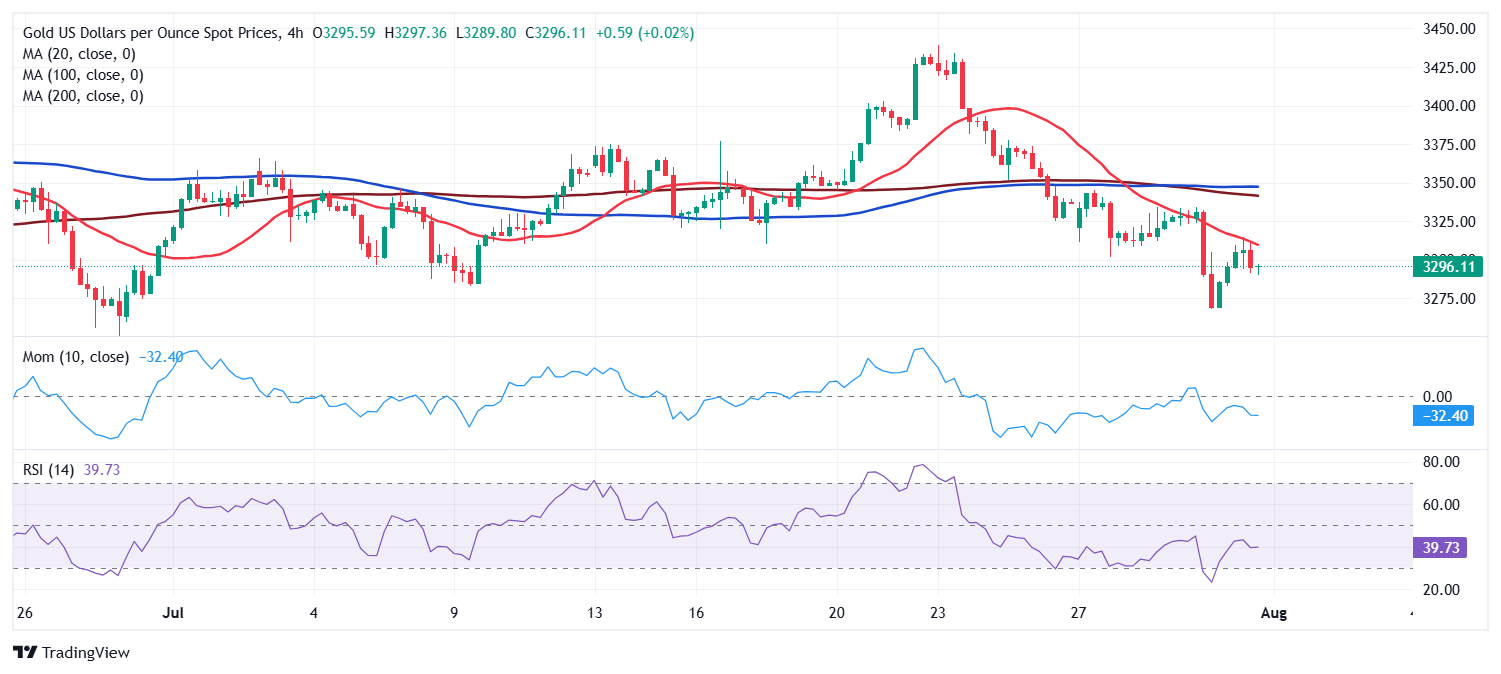
The 4-hour chart shows XAU/USD has room to extend its slide. A firmly bearish 20 SMA provides intraday resistance while falling further below the 100 and 200 SMAs. At the same time, technical indicators resumed their slides after failing to overcome their midlines, presenting sharp downward slopes.
Support levels: 3,281.90 3,268.00 3,246.20
Resistance levels: 3,311.15 3,328.60 3,345.00
Premium
You have reached your limit of 3 free articles for this month.
Start your subscription and get access to all our original articles.
Author

Valeria Bednarik
FXStreet
Valeria Bednarik was born and lives in Buenos Aires, Argentina. Her passion for math and numbers pushed her into studying economics in her younger years.


