Gold Price Forecast: XAU/USD remains exposed to downside risks ahead of a big week
- Gold price looks vulnerable as Fed’s tapering bets remain unfazed by poor NFP.
- Elevated US yields amid rising inflation expectations, soaring energy costs weigh on gold.
- Gold price keeps $1725 in sight while below critical 21-DMA resistance.

Gold price defied the bearish odds and witnessed a wild ride, maintaining mild gains above $1750 on Friday while ending the week marginally lower. Gold price wavered in a familiar range between $1760-$1750 almost during the first half of the trading day before exploding to two-week highs of $1781. The buying resurgence came in after the US Nonfarm Payrolls rose by 194K in September, missing the market expectation of 500K by a big margin.
However, sellers quickly fought back control and knocked gold price back towards the lower levels, as the dismal NFP failed to temper the Fed’s tapering expectations. Markets believed that rising wage pressures will exacerbate inflation further, which could lead the Fed to pare back bond-buying as early as the next month. The NFP disappointment roiled the sentiment on Wall Street, helping put a floor under gold price.
Starting out a fresh week on Monday, gold price is fluctuating between gains and losses, trading on the back foot, as the market sentiment worsens and lifts the US dollar’s safe-haven demand. Persisting Fed’s tapering calls and surging energy prices-led higher inflation expectations continue to keep the Treasury yields elevated, aiding the greenback’s rebound. Despite the latest leg down, gold price manages to draw support from the renewed US-China tensions over Taiwan and phase one trade deal.
Looking ahead, the Fed tapering speculations and energy crisis will continue to dominate the market sentiment amid holiday-thinned light trading conditions, as the US and Canada are closed in observance of their respective national holiday. Investors await Wednesday’s US inflation data and the FOMC minutes for a decisive move in gold price.
Gold Price Chart - Technical outlook
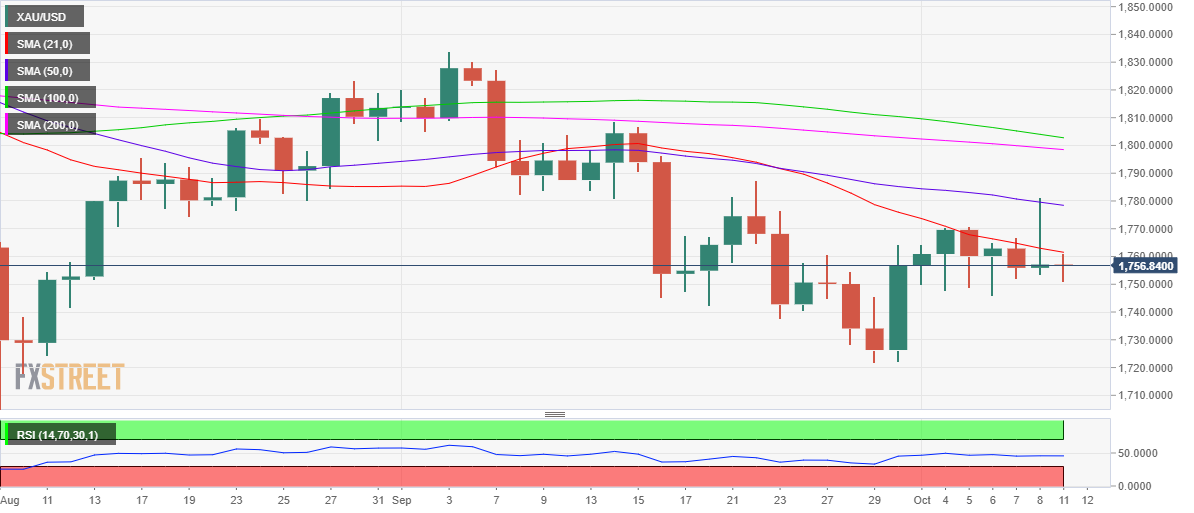
Gold: Daily chart
Gold’s daily chart shows that the price failed to find acceptance above the short-term critical resistance of the 21-Daily Moving Average (DMA) at $1762 on Friday, leaving the downside risks exposed.
The 14-day Relative Strength Index (RSI) trades flatlined but below the midline, suggesting the bearish grip on gold price remains intact.
On a daily closing below the $1750-$1745 demand area, the multi-week troughs near $1720 could be on the gold sellers’ radars.
Alternatively, a firm break above the 21-DMA barrier is critical to initiate a convincing uptrend in gold price.
The downward-sloping 50-DMA at $1778 will be back in play, above which a test of the $1800 round number will be inevitable. Near that level, the crucial 200-DMA emerges.
Author

Dhwani Mehta
FXStreet
Residing in Mumbai (India), Dhwani is a Senior Analyst and Manager of the Asian session at FXStreet. She has over 10 years of experience in analyzing and covering the global financial markets, with specialization in Forex and commodities markets.


