|

Gold Price Forecast: XAU/USD pressures record highs aims to extend its rally

XAU/USD Current price: $3,329.78

  • Renewed trade tensions between the US and China fuel demand for safety.
  • Fitch Ratings lowered its forecast for world growth amid the trade war escalation.
  • XAU/USD retains gains near record highs, rally far from over.

As the trade war resumed, so did Gold’s rally. The XAU/USD pair traded as high as $3,333.10 in the American afternoon on Wednesday, a fresh record high. Tensions between the United States (US) and China escalated after US President Donald Trump said China could face levies up to 245%, as a result of Beijing's retaliatory actions.

Additionally, Trump launched an investigation into the "national security risks posed by US reliance on imported processed critical minerals and their derivative products."

As a result, Fitch Ratings published a report stating that it has sharply lowered its forecasts for world growth in response to the severe escalation in the global trade war. In a special update to its quarterly Global Economic Outlook, Fitch has cut world growth in 2025 by 0.4pp and China and US growth by 0.5pp from the March edition.

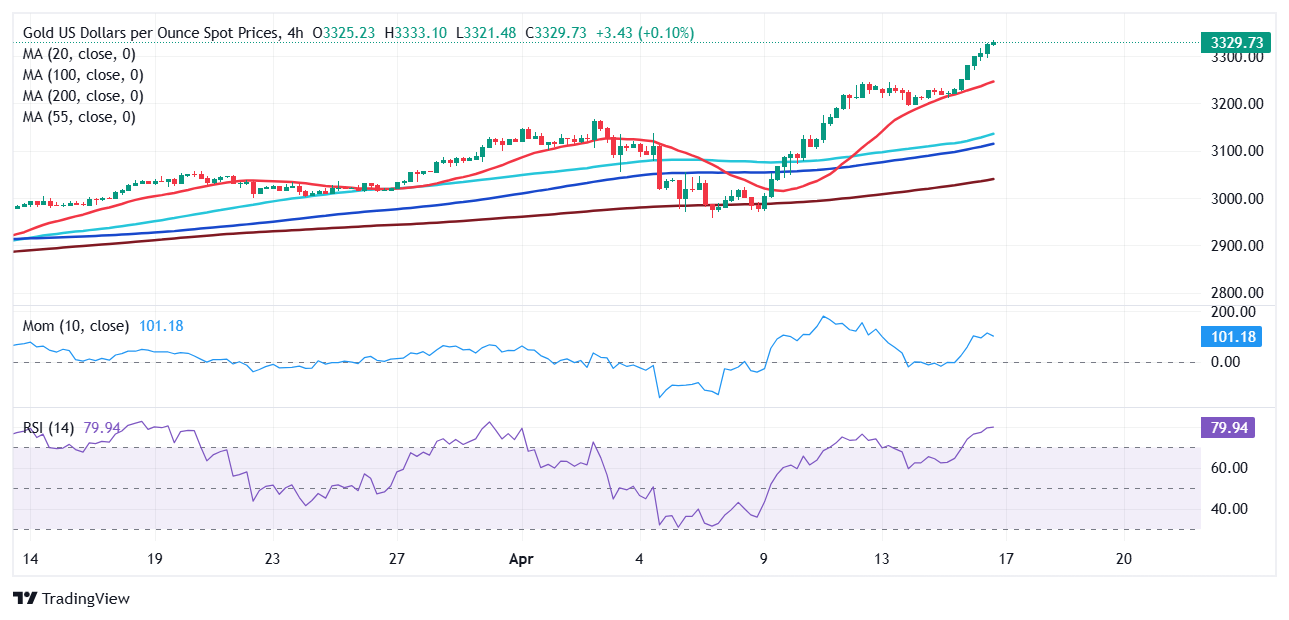
XAU/USD short-term technical outlook

The XAU/USD pair trades near its record high, and the daily chart supports another leg north. Technical indicators aim firmly north within overbought readings, while the pair remains far above all bullish moving averages. The 20 Simple Moving Average (SMA) currently hovers around $3,100, turning into a strong mid-term dynamic support should Gold finally correct lower.

The 4-hour chart shows that the Momentum indicator heads north well above its midline, while the Relative Strength Index (RSI) indicator consolidates at around 80, reflecting extreme overbought conditions yet far from suggesting XAU/USD may change course anytime soon. At the same time, the 20 SMA keeps advancing firmly higher, far above the longer ones, in line with the dominant bullish trend.

Support levels: 3,317.20 3,305.65 3,292.80

Resistance levels: 3,335.00 3,350.00 3,375.00

Premium

You have reached your limit of 3 free articles for this month.

Start your subscription and get access to all our original articles.

Subscribe to PremiumSign In

Author

Valeria Bednarik

Valeria Bednarik was born and lives in Buenos Aires, Argentina. Her passion for math and numbers pushed her into studying economics in her younger years.

More from Valeria Bednarik
Share:

Markets move fast. We move first.

Orange Juice Newsletter brings you expert driven insights - not headlines. Every day on your inbox.

By subscribing you agree to our Terms and conditions.

Editor's Picks

EUR/USD edges higher to mid-1.1600s; looks to US PCE Price Index for fresh impetus

The EUR/USD pair attracts some dip-buyers during the Asian session on Friday and recovers a part of the previous day's retracement slide from the 1.1680 region, or the highest level since October 17. Spot prices currently trade around mid-1.1600s and remain on track to register gains for the second straight week.

GBP/USD: Constructive view prevails above 1.3300 ahead of US PCE inflation data

The GBP/USD pair trades on a flat note near 1.3330 during the Asian trading hours on Friday. Traders prefer to wait on the sidelines ahead of the key US inflation report later on Friday. The US delayed Personal Consumption Expenditures Price Index report for September could offer some hints about the US interest rate path.

Gold flat lines above $4,200 mark; looks to US PCE Price Index for some meaningful impetus

Gold struggles to capitalize on the overnight bounce from the $4,175 area, or the vicinity of the weekly trough, and oscillates in a narrow trading range during the Asian session on Friday. Traders now seem reluctant and opt to move to the sidelines ahead of the September Personal Consumption Expenditures Price Index, or the Federal Reserve's preferred inflation gauge. 

Pi Network: Bearish streak nears critical support trendline

Pi Network edges lower on Friday for the third consecutive day, approaching a local support trendline. The on-chain data suggests an increase in supply pressure as Centralized Exchanges experience a surge in inflows. Technically, the pullback in PI risks further losses, as the Moving Average Convergence Divergence indicator is flashing a sell signal. 

Why the Fed may cut rates in December: Understanding the policy shift

The Fed has gone through a noticeable policy swing in recent months - from initiating a rate cut, to signaling a potential pause, and now shifting once again toward another cut in December. This has created understandable confusion among traders and investors trying to interpret the Fed’s reaction function.

XRP edges lower despite record on-chain activity and steady ETF inflows

Ripple is trading under pressure at the time of writing on Thursday, after bulls failed to break the short-term resistance at $2.22. The reversal may extend toward Monday’s low of $1.98, especially if risk-off sentiment persists in the broader cryptocurrency market.