Gold Price Forecast: XAU/USD pressures record highs, aims to extend gains

XAU/USD Current price: $3,036.41
- Mounting geopolitical tensions boosted demand for the bright metal.
- The focus shifts to the US Federal Reserve’s monetary policy announcement.
- XAU/USD pressures record highs, aims to extend its rally.
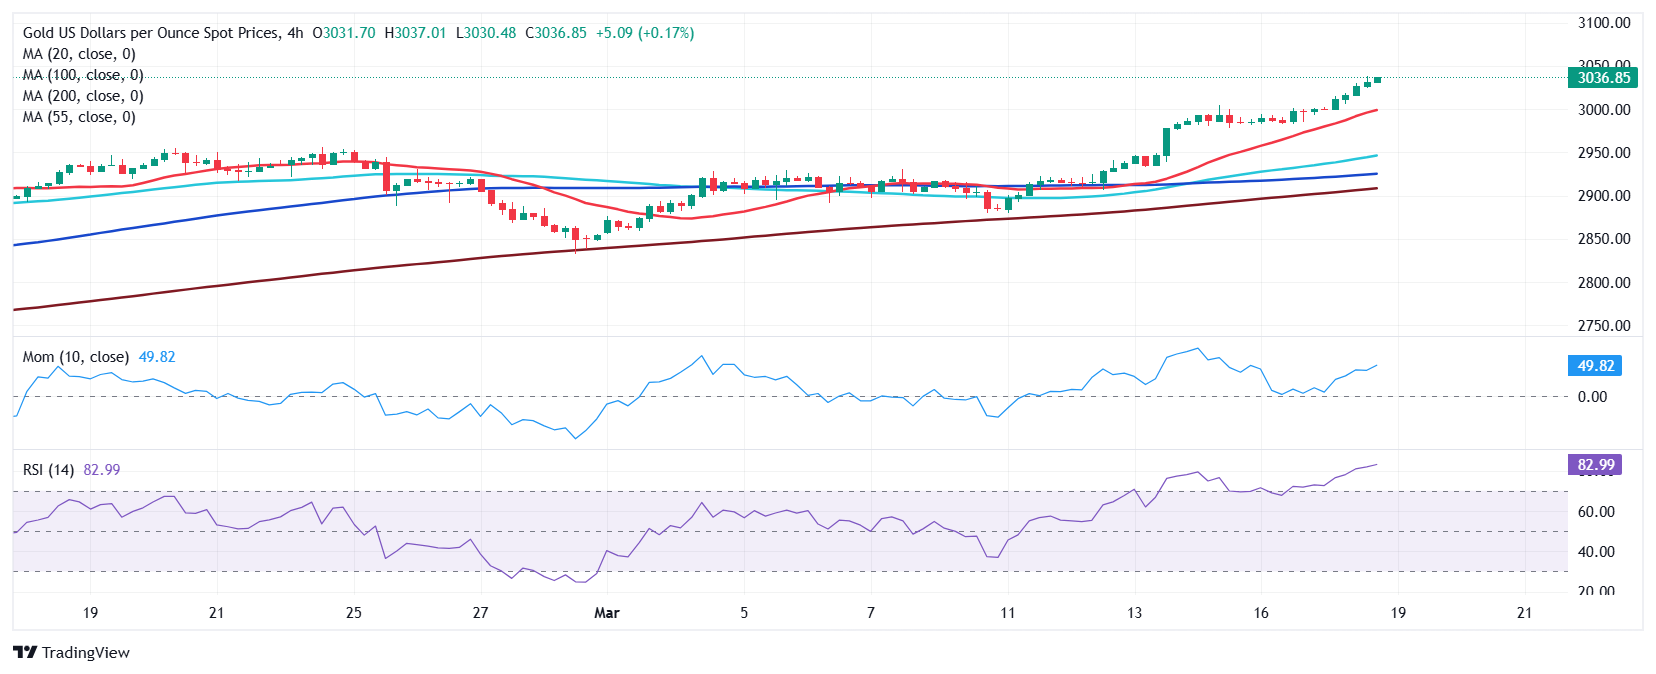
XAU/USD reached a fresh all-time high of $3,038.33 on Tuesday, trading nearby in the mid-American session. The bright metal benefited from mounting geopolitical jitters on different fronts.
On the one hand, Israeli Prime Minister Benjamin Netanyahu accused Hamas of breaking the peace agreement by refusing to release hostages and resuming attacks on Gaza, reviving the Middle East conflict despite the United States' (US) efforts to maintain the cease-fire.
On the other hand, US President Donald Trump is set to call its Russian counterpart, Vladimir Putin, to reestablish the relationship between the two countries and discuss a possible end to the Russia-Ukraine war. Meanwhile, US President Trump engaged in airstrikes on Yemen as a response to the Houthis' attack on US vessels in the Red Sea over the weekend.
Meanwhile, trade war concerns weigh on the US Dollar (USD). The Greenback hit fresh 2025 lows against European rivals, maintaining its broad weakness despite a dismal mood.
On Wednesday, the Federal Reserve (Fed) will announce its decision on monetary policy. As previously explained, the Fed is widely anticipated to keep the benchmark interest rate on hold at 4.25%-4.50% amid the uncertainty surrounding US President Trump’s trade war and its impact on the economic performance of the world’s largest economy. At the same time, the central bank will also release the Summary of Economic Projections (SEP) or dot plot, a document providing a fresh view of the overall state of the American economy alongside officials' aims at interest rate moves. Finally, Chairman Jerome Powell will deliver a press conference.
XAU/USD short-term technical outlook
The XAU/USD pair trades near its record high and technical readings in the daily chart suggest the bullish run will continue. Technical indicators head firmly north without signs of upward exhaustion despite the Relative Strength Index (RSI) indicator standing at overbought levels. At the same time, the bright metal develops well above all its moving averages, with the 20 Simple Moving Average (SMA) resuming its advance and currently standing at around $2,931.
The near-term picture also favors an upward extension. In the 4-hour chart, the 20 SMA accelerates north far above also bullish 100 and 200 SMAs. Still, the aforementioned 20 SMA stands at around $2,995, well below the current level. At the same time, the Momentum indicator diverges lower, easing within positive levels, while the Relative Strength Index (RSI) indicator consolidates at around 80. A corrective slide is possible, but buyers will likely take their chances on dips.
Support levels:3,010.40 2,996.90 2,978.40
Resistance levels: 3,040.00 3,055.00 3,070.00
Author

Valeria Bednarik
FXStreet
Valeria Bednarik was born and lives in Buenos Aires, Argentina. Her passion for math and numbers pushed her into studying economics in her younger years.

















