Gold Price Forecast: XAU/USD needs validation from 50 DMA to extend the recovery
- Gold price rebound fizzles out as US Dollar finds support from risk-aversion.
- Gold traders will likely reposition ahead of the key United States inflation data.
- Gold price could retest $1,925 as the daily RSI stays bearish, 50 DMA acts as a tough resistance.


Despite Friday’s rebound, Gold price ended the week in the red, having set fresh three-week lows at $1,926. Gold price returns to the red at the start of a critical week on Monday, as the United States Dollar (USD) finds renewed safe-haven bids from broad risk-aversion, in the wake of Sino-Taiwan geopolitical tensions and nervousness heading into the US Consumer Price Index (CPI) week.
Traders stay tentative, as the US inflation week kicks in
The US Dollar is trying to find its feet after the mixed United States employment data-led sharp sell-off in the US Treasury bond yields, which eventually extended the correction in the Greenback while lifting Gold price from multi-week troughs.
The headline US Nonfarm Payrolls rose by only 187K in July as against the expectations of 200K while the country’s Unemployment Rate unexpectedly fell to 3.5% in July and the Average Hourly Earnings rose 4.4% in the reported month vs. a 4.2% increase expected. A below 200K figure in the US payrolls figure and a downward revision to 185K in the June print, suggested that the US labor market is finally cooling, strengthening the market’s belief that the US Federal Reserve (Fed) is close to ending its tightening cycle.
In the day ahead, risk sentiment will play a key role in the US Dollar dynamics, as there is no significant economic data release from the North American economy. Meanwhile, speeches from Fed policymakers could be also closely scrutinized for fresh hints on the central bank’s policy outlook. Any moves, however, could remain limited in the Greenback, as well as, the Gold price ahead of Thursday’s all-important US CPI data release.
Investors also remain wary over the renewed geopolitical risks, involving China and Taiwan. Early Asia, Taiwan's Defense Minister said that in the last 24 hours, 12 Chinese Air Force planes have entered Taiwan's air defense zone.
Gold price technical analysis: Daily chart
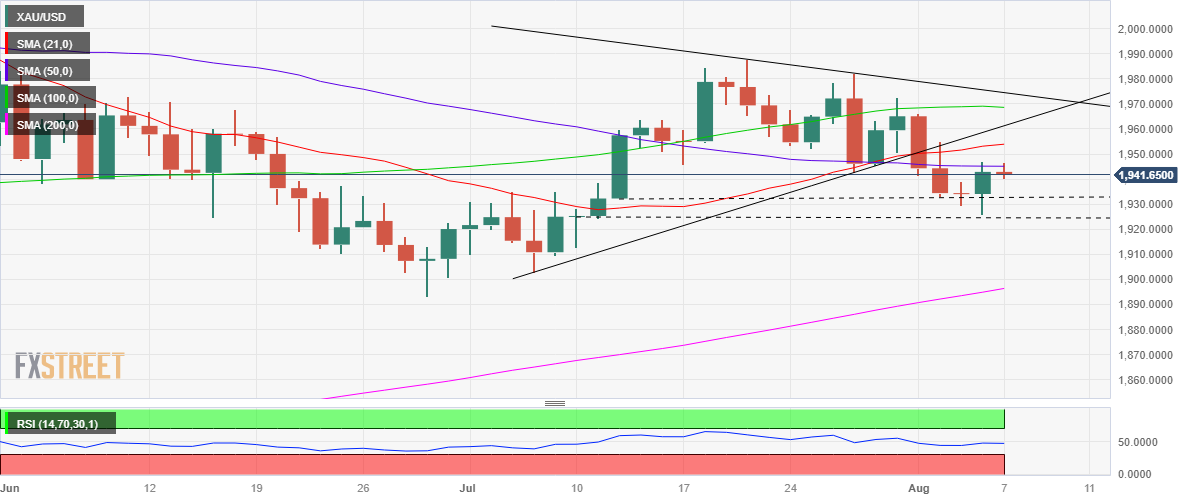
Following a Doji candlestick charted on a daily closing basis last Thursday, Gold price staged a solid rebound from fresh three-week lows of $1,926, finally settling Friday above the critical support at $1,932, the July 12 low.
The 14-day Relative Strength Index (RSI) indicator, however, still lurks beneath the midline, suggesting that Gold sellers could very well regain control in the week ahead. Also, a symmetrical triangle breakdown seen in the last week continues to favor the downside in the Gold price.
Immediate support at the July 12 low of $1,932 needs to crack on a daily closing basis to retest the multi-week troughs near $1,925. Further south, early July lows around the $1,910 region will be the line in the sand for Gold buyers.
On the flip side, any recovery will need to find acceptance above the flattish 50-Daily Moving Average (DMA) at $1,945, above which a fresh run toward the bullish 21 DMA at $1,954 will be in the offing. The next relent upside barrier is envisioned at $1,961, which is the triangle support-turned-resistance.
Author
Dhwani Mehta
FXStreet
Residing in Mumbai (India), Dhwani is a Senior Analyst and Manager of the Asian session at FXStreet. She has over 10 years of experience in analyzing and covering the global financial markets, with specialization in Forex and commodities markets.

















