Gold Price Forecast: XAU/USD nears $3,100 as fears receded

XAU/USD Current price: $3,107.41
- US President Donald Trump will announce reciprocal tariffs on Wednesday.
- Financial markets remain cautious but fears receded, and Wall Street advances.
- XAU/USD corrective decline set to continue below $3,100 in the near term.
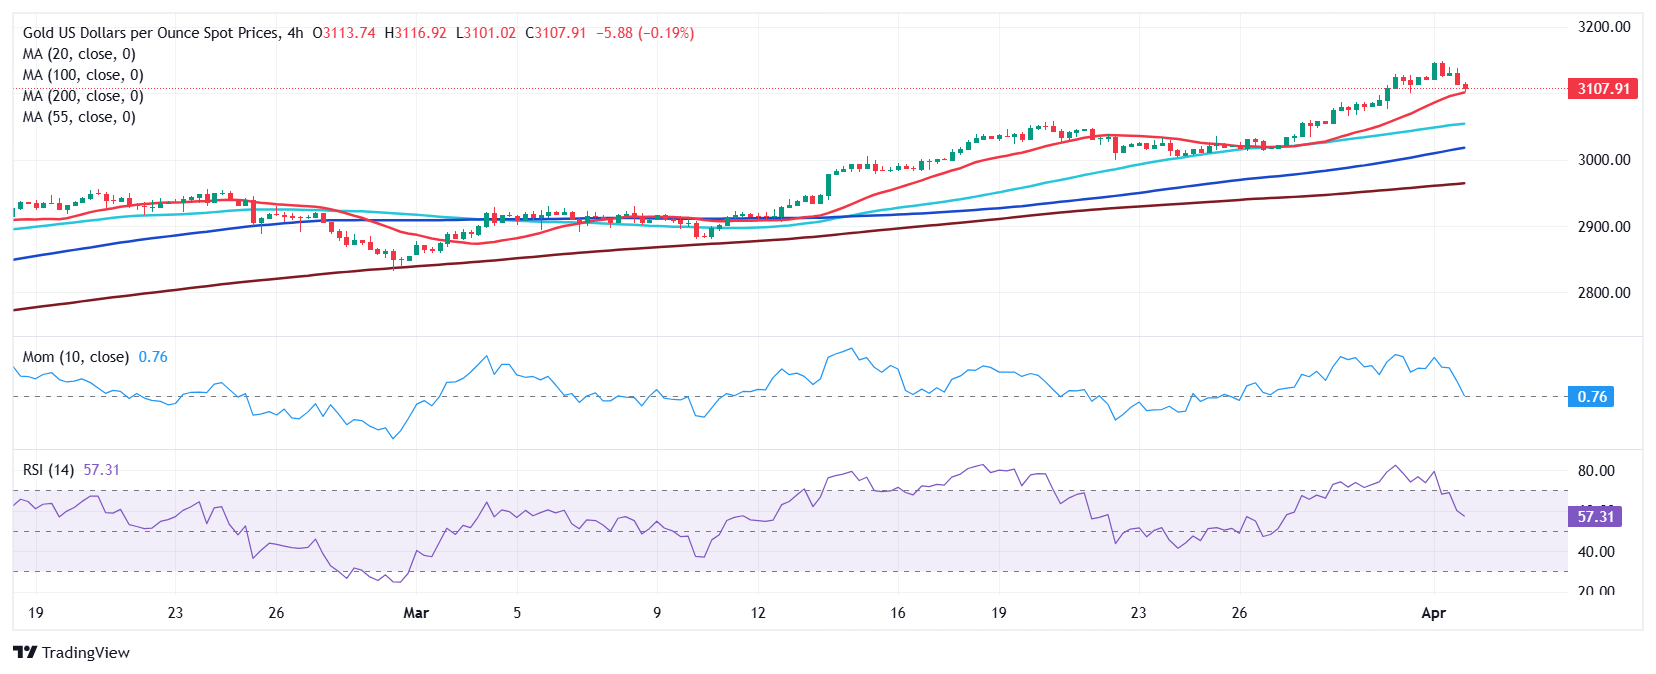
The pair posted yet another record high, hitting $3,149.04 on Tuesday. The risk-averse environment backed the bright metal as market players gear up for tariffs’ announcements.
United States (US) President Donald Trump has been long anticipating a massive levies announcement for April 2, with little detail on the extent of taxes. Market players fear the so-called Liberation Day will include massive tariffs that can affect the global economy. Trump will unveil his plans in a Rose Garden press conference scheduled for Wednesday at 19:00 GMT
Gold changed course after Wall Street’s opening despite the US Dollar (USD) weakening on the back of poor local data. On the one hand, the number of job openings on the last business day of February stood at 7.56 million, according to the JOLTS Job Openings report, pretty much unchanged from the 7.76 million openings reported in January. On the other hand, the ISM Manufacturing Purchasing Managers Index (PMI) dropped to 49 in March, down from the 50.3 posted in February, while missing expectations of 49.5.
Further weighing on Gold price, Wall Street managed to shrug off Monday’s dismal mood and the three major indexes trade in the green at the time of writing.
XAU/USD short-term technical outlook
The XAU/USD pair retreats towards $3,100, as profit taking ahead of major and a better market mood take their toll. The daily chart shows the pair is in the red, yet also that it posted a higher high and a higher low, limiting its bearish potential. The same chart shows technical indicators turned lower, but remain within overbought levels. Finally, all moving averages remain far below the current level and heading higher, with the 20 Simple Moving Average (SMA) currently at around $3,001.00.
The near-term picture suggests the bright metal could extend its slide in the upcoming sessions. Technical indicators head firmly lower in the 4-hour chart, although still holding above their midlines. At the same time, the intraday slide stalled just above a bullish 20 SMA, the latter acting as dynamic support at $3,097.20. The 100 and 200 SMAs, in the meantime, maintain their downward slopes far below the current level.
Support levels: 3,097.50 3,082.90 3,068.90
Resistance levels: 3,122.85 3,136.70 3,150.00
US-China Trade War FAQs
Generally speaking, a trade war is an economic conflict between two or more countries due to extreme protectionism on one end. It implies the creation of trade barriers, such as tariffs, which result in counter-barriers, escalating import costs, and hence the cost of living.
An economic conflict between the United States (US) and China began early in 2018, when President Donald Trump set trade barriers on China, claiming unfair commercial practices and intellectual property theft from the Asian giant. China took retaliatory action, imposing tariffs on multiple US goods, such as automobiles and soybeans. Tensions escalated until the two countries signed the US-China Phase One trade deal in January 2020. The agreement required structural reforms and other changes to China’s economic and trade regime and pretended to restore stability and trust between the two nations. However, the Coronavirus pandemic took the focus out of the conflict. Yet, it is worth mentioning that President Joe Biden, who took office after Trump, kept tariffs in place and even added some additional levies.
The return of Donald Trump to the White House as the 47th US President has sparked a fresh wave of tensions between the two countries. During the 2024 election campaign, Trump pledged to impose 60% tariffs on China once he returned to office, which he did on January 20, 2025. With Trump back, the US-China trade war is meant to resume where it was left, with tit-for-tat policies affecting the global economic landscape amid disruptions in global supply chains, resulting in a reduction in spending, particularly investment, and directly feeding into the Consumer Price Index inflation.
Author

Valeria Bednarik
FXStreet
Valeria Bednarik was born and lives in Buenos Aires, Argentina. Her passion for math and numbers pushed her into studying economics in her younger years.
















