Gold Price Forecast: XAU/USD losing bullish momentum, still up

XAU/USD Current price: $2,357.41
- US Consumer Confidence unexpectedly surged in May, according to CB.
- Federal Reserve officials maintained a cautious tone about inflation progress.
- XAU/USD turned neutral in the near term, needs to conquer the $2,360 threshold.
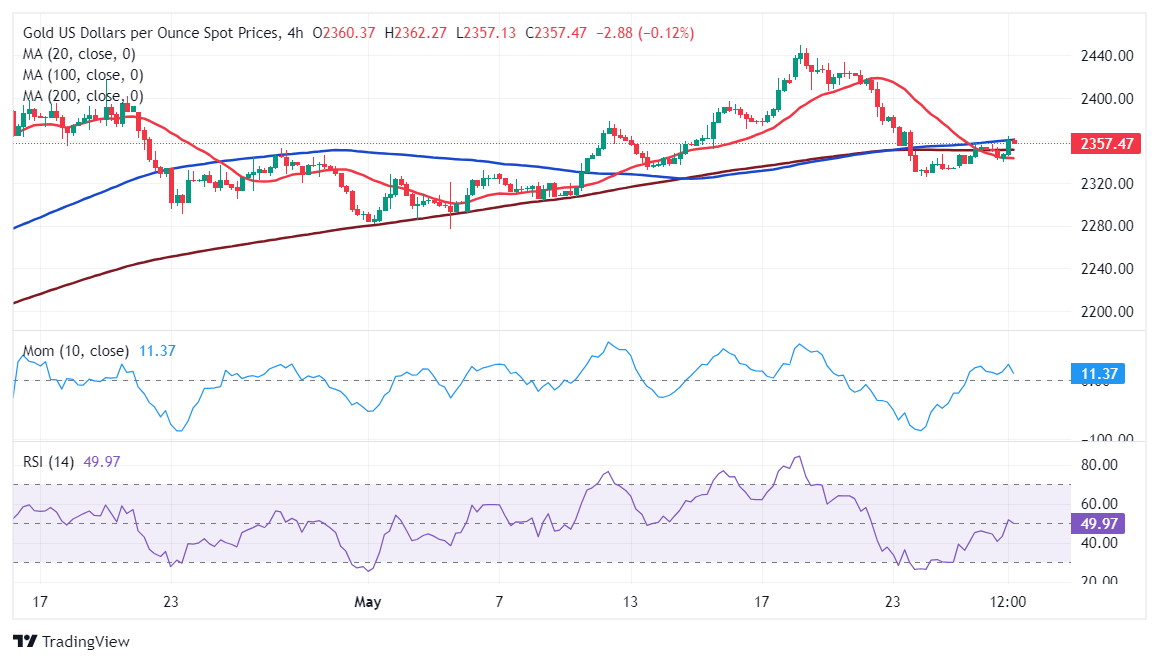
Gold kept recovering on the broad US Dollar's weakness and regardless of the market mood, with XAU/USD trading around $2,360. The Greenback enjoyed temporal demand at the beginning of the American session, following the release of upbeat data.
The United States (US) released the S&P/Case-Shiller Home Price Index, which improved to 7.4% in March, beating expectations. Also, the Conference Board Consumer Confidence Index unexpectedly improved in May to 102.0 from an upwardly revised 97.5 in April. The Present Situation sub-index increased to 143.1 from 140.6 previously, while the Expectations sub-index rose to 74.6 from 68.8, still below the 80 threshold, which usually signals a recession ahead.
Wall Street, however, could not take advantage of the news. Following the dismal performance of their overseas counterparts, US indexes trade with a mixed tone, with the Dow Jones Industrial Average (DJIA) dipping in the red, the S&P500 hovering around its opening level, and the Nasdaq Composite up 82 points.
Meanwhile, Federal Reserve (Fed) officials delivered cautious words about inflation. On the one hand, Governor Michelle Bownan said she would have supported either waiting to slow the quantitative tightening pace or a more tapered slowing in balance sheet run-off. On the other, Minneapolis Fed's President Neel Kashkari said the US economy has remained remarkably resilient and that he does not see a need to hurry to cut rates. He added that policymakers should not rule anything out on the monetary policy path and that he would prefer to see more months of positive inflation data before a rate cut.
XAU/USD short-term technical outlook
XAU/USD is up for a third consecutive day. In the daily chart, technical indicators have partially lost their upward strength but hold within positive levels. At the same time, the pair is hovering around a mildly bullish 20 Simple Moving Average (SMA), while the longer moving averages head firmly north, far below the current level. The overall stance is positive, albeit the momentum is missing.
In the near term, and according to the 4-hour chart, XAU/USD has turned neutral. The Momentum indicator is flat, just above its 100 level, while the Relative Strength Index (RSI) indicator aims marginally higher at around 49. The 20 SMA heads south below the longer ones, yet the pair met intraday support around it, while a mildly bullish 100 SMA acts as dynamic resistance around $2,360.
Support levels: 2,340.20 2,325.30 2,307.10
Resistance levels: 2,364.00 2,372.90 2,384.15
Author

Valeria Bednarik
FXStreet
Valeria Bednarik was born and lives in Buenos Aires, Argentina. Her passion for math and numbers pushed her into studying economics in her younger years.

















