Gold Price Forecast: XAU/USD looks vulnerable amid bearish technical setup, ahead of ISM
- Gold price extends Friday’s weakness starting out a fresh month.
- US dollar holds the recent recovery gains amid rising covid and China worries.
- Gold’s 4H technical setup points to downside risks ahead of the US ISM PMI.

Gold price corrected from near two-week highs of $1833 on Friday, as the US dollar snapped its dovish Fed-led downtrend and rebounded firmly amid the downbeat market mood. Risk-aversion was at full steam after Amazon’s earnings disappointed and Delta covid strain flareups globally overwhelmed markets, raising concerns over the economic recovery and, in turn, lifting the dollar’s safe-haven appeal. The US Core PCE inflation missed expectations with 3.5% in June, which also added to the dour mood.
Starting off a fresh month, gold price is licking its wounds, as the US dollar holds onto the recent recovery gains amid surging Asia-pac covid cases. Meanwhile, a drop in the Chinese manufacturing sector activity and an intensifying crackdown by the country’s market regulator also keep the investors cautious and rooting for the US currency. However, the optimism on the US infrastructure spending bill appears to put a floor under gold price (for now).
If the risk-aversion deepens in the sessions ahead, then the greenback’s recovery could regain momentum at gold’s expense. Further, the US ISM Manufacturing PMI release could also set the tone for gold price this week, as the data would throw fresh light on the strength of the US economic recovery heading into the NFP showdown.
Gold Price Chart - Technical outlook
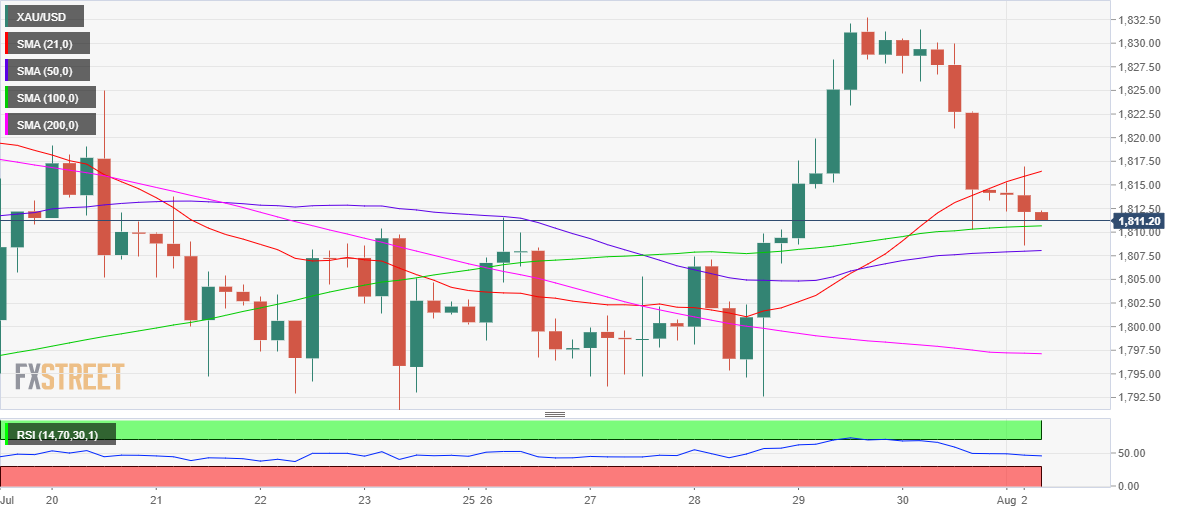
Gold: Four-hour chart
Gold price has bounced off the horizontal 50-Simple Moving Average (SMA) at $1808 on the four-hour chart earlier on.
In doing so, the yellow metal has recaptured the 100-SMA resistance now support at $1811.
However, with the Relative Strength Index (RSI) still pointing south below the midline, the downside bias remains intact.
Therefore, a breach of the 100-SMA once again could call for a retest of the 50-SMA cushion.
A four-hourly candlestick closing below the latter could trigger a fresh downswing towards the bearish 200-SMA at $1797.
Further south, the bulls may seek support around the $1792 area, the previous week’s range lows.
On the flip side, if the 100-SMA support holds, then the recovery momentum could challenge the upward-pointing 21-SMA at $1816.
The next upside target is seen at the $1820 round figure.
Premium
You have reached your limit of 3 free articles for this month.
Start your subscription and get access to all our original articles.
Author

Dhwani Mehta
FXStreet
Residing in Mumbai (India), Dhwani is a Senior Analyst and Manager of the Asian session at FXStreet. She has over 10 years of experience in analyzing and covering the global financial markets, with specialization in Forex and commodities markets.


