Gold Price Forecast: XAU/USD looks to recapture 50 DMA at $1,932, as RSI flips bullish
- Gold price extends recovery from weekly lows, as US Dollar corrects.
- Traders stay cautious ahead of Chinese inflation data and G20 Summit on Saturday.
- Gold price eyes additional recovery on a sustained move above 50-Daily Moving Average.

Gold price is building on the previous recovery early Friday, looking to reclaim the $1,930 round level. The United States Dollar (USD) sees an extended correction from six-month highs, tracking the US Treasury bond yields lower.
Gold price cheers US Dollar retreat, risk aversion
The US Dollar retracement is gathering strength, despite a risk-averse market environment, as traders prefer to lock in profits on their USD longs ahead of China’s inflation data and the G20 leaders summit on Saturday. Further, the US Federal Reserve (Fed) enters its ‘blackout period’ from Saturday, prompting markets to reposition before next week’s all-important United States Consumer Price Index (CPI) data release.
Additionally, China's slowdown concerns, rising oil prices and the Fed’s ‘higher-for-longer’ interest rate view are also contributing to broad risk aversion. The renewed weakness in the Chinese currency is also keeping investors on tenterhooks, as they contemplate the next move by the country’s authorities to stem the slide.
Meanwhile, the US Dollar and the US Treasury bond yields failed to sustain the brief upside fuelled by the strong US labor market data on Thursday, which showed that Initial Jobless Claims fell 13,000 to 216,000 in the week ended Sept. 2, the lowest level since February and the fourth straight weekly decline. This could be due to the downward revision to the Nonfarm Productivity for the second quarter.
The US Dollar-denominated Gold price is set to snap its two-week uptrend, as it attempts further recovery from one-week lows of $1,915 reached on Wednesday. The end-of-week flows could aid the renewed upside in the Gold price, especially if the US Dollar correction picks up pace later in the day.
It’s a data-light US docket, and therefore, risk sentiment and Fedspeak will hold the key to influencing the next moves in the Gold price.
Gold price technical analysis: Daily chart
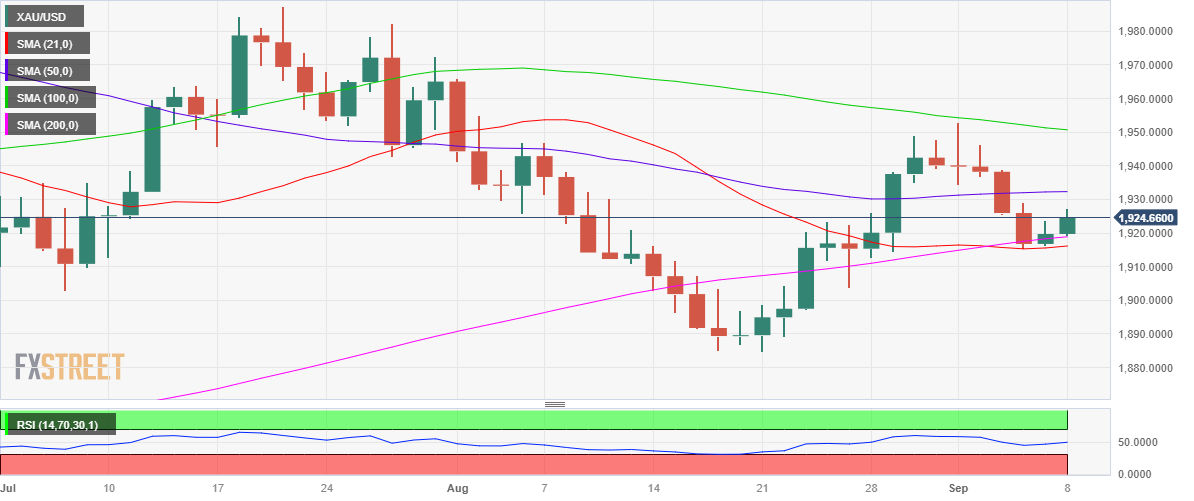
Technically, the tide seems to have turned in favor Gold buyers, as the 14-day Relative Strength Index (RSI) is back above midline, within the bullish territory.
The immediate resistance awaits at the 50-Daily Moving Average (DMA) at $1,932. A firm break above that barrier will call for a test of the 100 DMA hurdle at $1,951.
The static resistance of $1,970 and the July 27 high of $1,982 will be next on the radar for Gold buyers.
On the flip side, Gold sellers need to find a strong foothold below the 21 and 200 DMAs confluence support at $1,916, below which the initial demand area is seen at the previous week’s low of $1,904.
The next relevant downside cushion is envisioned at the $1,900 threshold, below which a sell-off toward $1,885 cannot be ruled.
Premium
You have reached your limit of 3 free articles for this month.
Start your subscription and get access to all our original articles.
Author

Dhwani Mehta
FXStreet
Residing in Mumbai (India), Dhwani is a Senior Analyst and Manager of the Asian session at FXStreet. She has over 10 years of experience in analyzing and covering the global financial markets, with specialization in Forex and commodities markets.


