Gold Price Forecast: XAU/USD looks south as the US CPI inflation week kicks in
- Gold price trades on the wrong footing at the start of the new week.
- Markets stay cautious amid holiday-thinned trade, ahead of Tuesday’s US CPI data.
- Gold price tests critical daily support line at $2,023, as RSI flips bearish.

Gold price is looking to extend the previous week’s downtrend at the start of the new week on Monday. Gold price is testing the $2,020 level even though the US Dollar (USD) and the US Treasury bond yields remain on the back foot amid holiday-thinned trading conditions. Most of the major Asian markets are closed on Monday, in observance of the Lunar New Year holiday.
Gold price stays vulnerable, with eyes on US CPI data
Markets are also sensing a calm before Tuesday’s US Consumer Price Index (CPI) data storm, as they refrain from placing any fresh directional bets on the US Dollar, as well as, the Gold price. Investors are resorting to adjusting their positions on the US Dollar, keeping the Greenback on the back foot so far this Monday.
Last week, the US Dollar managed to find its feet against its major rivals, despite markets paring back aggressive US Federal Reserve (Fed) interest rate cut bets, as a batch of strong US data affirmed the economic resilience.
Markets are now pricing only a 16% chance of a March Fed rate cut. Meanwhile, the odds of a rate cut by the Fed for the May meeting stand at about 60%.
Additionally, renewed concerns over China’s economic slowdown also helped revive the safe-haven demand for the US Dollar. However, further gains in the Greenback remained capped due to the risk-rally on global stocks on encouraging corporate results.
Looking ahead, Gold price is likely to maintain its bearish momentum amid pre-US CPI data-led caution trading and easing Israel-Hamas geopolitical tensions. The Israeli military said on Monday it had conducted a "series of strikes" on southern Gaza that has now "concluded," days after Israeli Prime Minister Benjamin Netanyahu rejected a ceasefire proposal from Hamas.
Speeches from Fed policymakers, however, will grab some attention ahead of the critical US inflation report for January, as it could pave the way for a dovish Fed pivot.
On Friday, the Labor Department's Bureau of Labor Statistics (BLS) unveiled the annual revisions to the CPI data. The CPI rose 0.2% in December instead of 0.3% as reported last month. But data for November was revised up to show the CPI increasing 0.2% rather than 0.1% as previously estimated. The CPI gained 0.1% in October vs. 0% reported previously.
Upward revisions to the US CPI figures briefly propelled US Treasury bond yields but surging Wall Street indices dulled the attractiveness of the yields and the safe-haven Gold price.
Gold price technical analysis: Daily chart
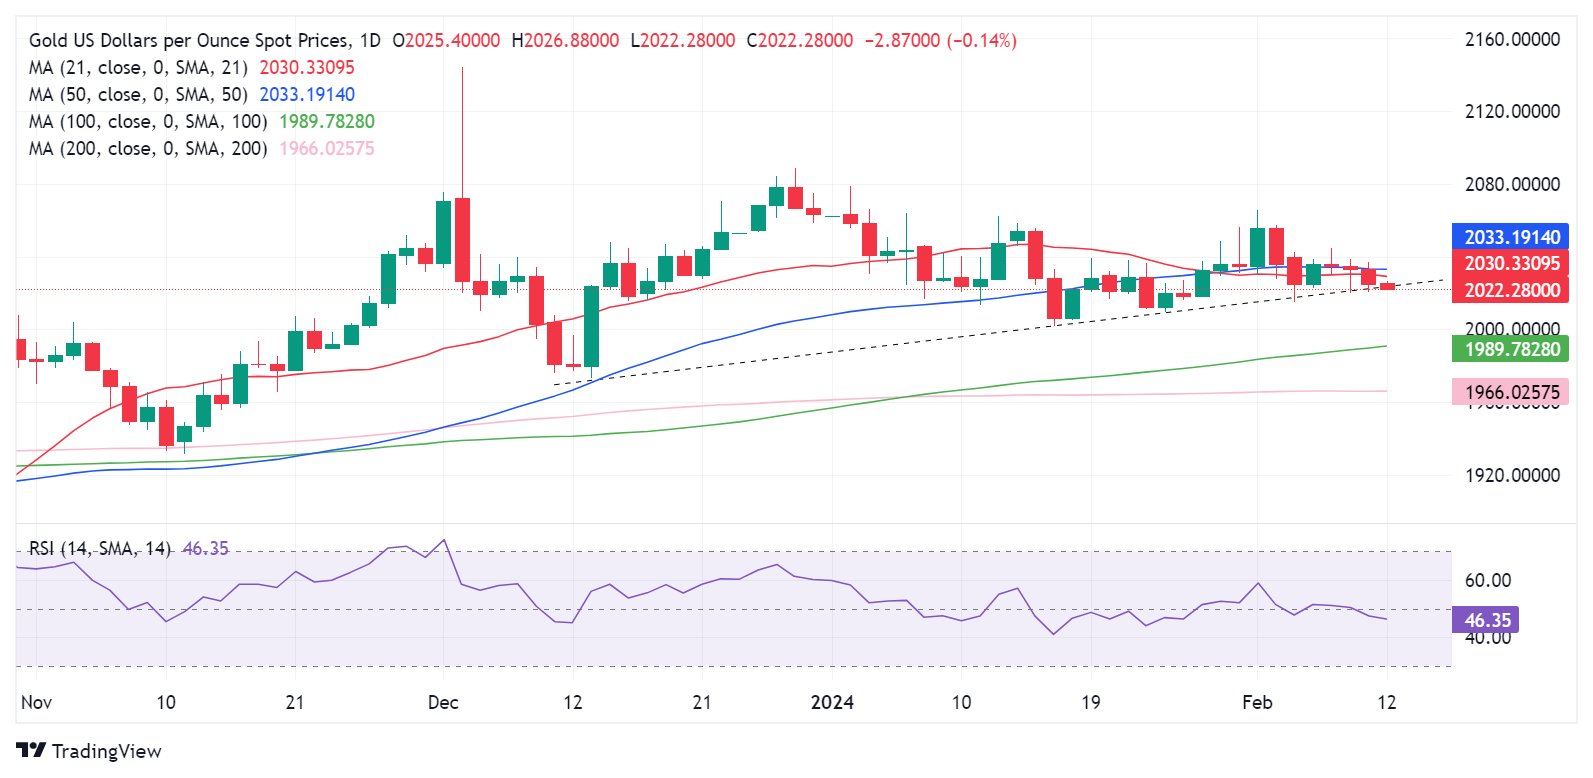
As observed on the daily chart, Gold price is teasing a downside break of the rising trendline support at $2,023.
A daily candlestick close below that level will trigger a fresh downside toward the $2,000 mark. Ahead of that, the $2,010 round figure will test bullish commitments.
The last line of defense for Gold buyers is envisioned at the ascending 100-day Simple Moving Average (SMA) at $1,990.
The 14-day Relative Strength Index (RSI) is pointing south below the 50 level, suggesting that there is more room for Gold sellers to flex their muscles.
Meanwhile, the 21-day and 50-day SMAs Bear Cross also remains in play.
On the flip side, if the trendline support at $2,023 holds, Gold buyers will challenge the $2,030-$2,035 supply zone on an initial rebound. That zone is the confluence of the 21-day and 50-day SMAs.
Further up, the $2,040 level will offer stiff resistance. Acceptance above the latter is needed to take on the $2,050 psychological level.
Gold FAQs
Why do people invest in Gold?
Gold has played a key role in human’s history as it has been widely used as a store of value and medium of exchange. Currently, apart from its shine and usage for jewelry, the precious metal is widely seen as a safe-haven asset, meaning that it is considered a good investment during turbulent times. Gold is also widely seen as a hedge against inflation and against depreciating currencies as it doesn’t rely on any specific issuer or government.
Who buys the most Gold?
Central banks are the biggest Gold holders. In their aim to support their currencies in turbulent times, central banks tend to diversify their reserves and buy Gold to improve the perceived strength of the economy and the currency. High Gold reserves can be a source of trust for a country’s solvency. Central banks added 1,136 tonnes of Gold worth around $70 billion to their reserves in 2022, according to data from the World Gold Council. This is the highest yearly purchase since records began. Central banks from emerging economies such as China, India and Turkey are quickly increasing their Gold reserves.
How is Gold correlated with other assets?
Gold has an inverse correlation with the US Dollar and US Treasuries, which are both major reserve and safe-haven assets. When the Dollar depreciates, Gold tends to rise, enabling investors and central banks to diversify their assets in turbulent times. Gold is also inversely correlated with risk assets. A rally in the stock market tends to weaken Gold price, while sell-offs in riskier markets tend to favor the precious metal.
What does the price of Gold depend on?
The price can move due to a wide range of factors. Geopolitical instability or fears of a deep recession can quickly make Gold price escalate due to its safe-haven status. As a yield-less asset, Gold tends to rise with lower interest rates, while higher cost of money usually weighs down on the yellow metal. Still, most moves depend on how the US Dollar (USD) behaves as the asset is priced in dollars (XAU/USD). A strong Dollar tends to keep the price of Gold controlled, whereas a weaker Dollar is likely to push Gold prices up.
Premium
You have reached your limit of 3 free articles for this month.
Start your subscription and get access to all our original articles.
Author

Dhwani Mehta
FXStreet
Residing in Mumbai (India), Dhwani is a Senior Analyst and Manager of the Asian session at FXStreet. She has over 10 years of experience in analyzing and covering the global financial markets, with specialization in Forex and commodities markets.


