• Gold corrects from six-week highs as US dollar rebounds amid Evergrande, covid woes.
  • US Treasury yields hold steady ahead of key economic releases.
  • Gold’s four-hour technical setup suggests an extended pullback.

Gold price ended the final day of 2021 on a bullish note, at the strongest levels in six weeks at $1,830. The year-end profit-taking in the US Treasury yields from monthly peaks helped gold extend its two-day rebound while the dollar also bore the brunt of repositioning. The benchmark 10-year rates briefly dropped below the 1.50% level before recapturing the latter and limiting gold’s upside. A negative finish to 2021 for Wall Street indices also underpinned the bullish tone in the bright metal. Gold price, however, booked the worst year since 2015 amid fading coronavirus fears and expectations of monetary policy normalization by major global central bankers in the year to come. Holiday-thinned market conditions further helped gold buyers, as the price added 0.71% on the day.

Gold price has started out the first trading day of 2022 on the wrong footing, as investors take profits off the table ahead of a busy week, full of top-tier US economic events. The US ISM PMIs, the FOMC minutes and Nonfarm Payrolls are likely to cheer the Fed hawks. The build-up to these events is prompting a rebound in the US dollar across the board, pulling gold price lower from fresh six-week highs of $1,832. Meanwhile, the US yields are trading listlessly, as most Treasuries are on a holiday in Asia. Concerns over surging covid cases globally and resurfacing China’s Evergrande risks seem to be aiding the recovery in the safe-haven dollar at gold’s expense. Later in the day, the Euro area and the US Markit Manufacturing PMIs will offer some trading incentives to gold traders after a holiday season lull.

Gold Price Chart - Technical outlook

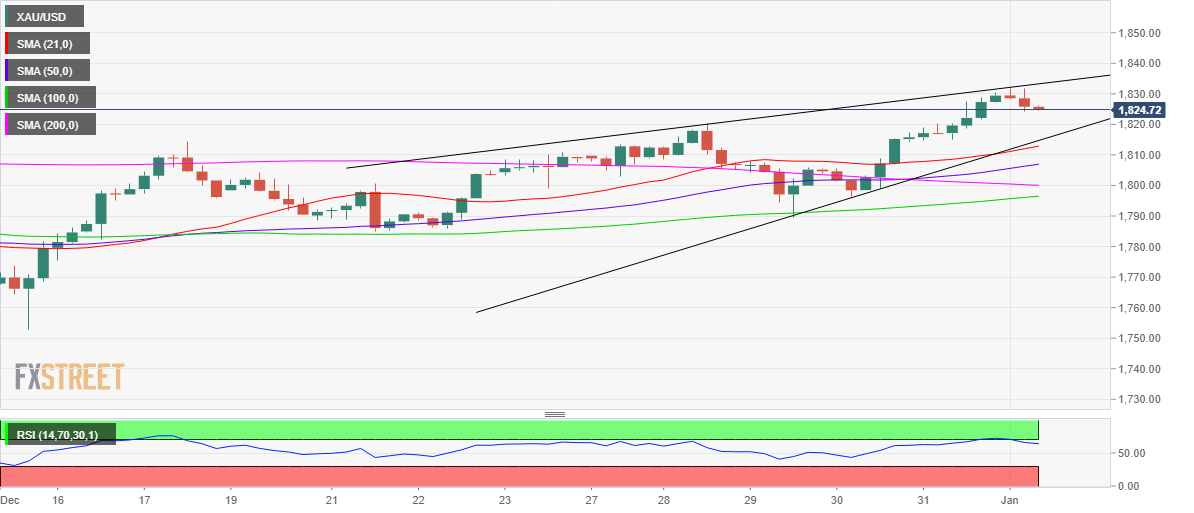
Gold: Four-hour chart

Gold’s four-hour chart shows that the price has turned south after running into a 10-day-old rising wedge hurdle at $1,832.

The retracement in gold price triggers a fresh drop towards the critical demand area around $1,814, which is the confluence of the wedge support and bullish 21-Simple Moving Average (SMA).

Ahead of that level, the 1,820 round number could get tested. If gold price yields a rising wedge breakdown on the said time frame, then a sell-off could kick in towards $1,800.

The Relative Strength Index (RSI) has edged lower, justifying the latest downtick. The leading indicator still remains in the positive zone, suggesting that the pullback could be a good buying opportunity.

Should the buyers regain control, the bright metal could see a retest of the multi-week highs of $1,832, above which a fresh upswing towards the November 22 highs of $1,849 cannot be ruled out.

Information on these pages contains forward-looking statements that involve risks and uncertainties. Markets and instruments profiled on this page are for informational purposes only and should not in any way come across as a recommendation to buy or sell in these assets. You should do your own thorough research before making any investment decisions. FXStreet does not in any way guarantee that this information is free from mistakes, errors, or material misstatements. It also does not guarantee that this information is of a timely nature. Investing in Open Markets involves a great deal of risk, including the loss of all or a portion of your investment, as well as emotional distress. All risks, losses and costs associated with investing, including total loss of principal, are your responsibility. The views and opinions expressed in this article are those of the authors and do not necessarily reflect the official policy or position of FXStreet nor its advertisers. The author will not be held responsible for information that is found at the end of links posted on this page.

If not otherwise explicitly mentioned in the body of the article, at the time of writing, the author has no position in any stock mentioned in this article and no business relationship with any company mentioned. The author has not received compensation for writing this article, other than from FXStreet.

FXStreet and the author do not provide personalized recommendations. The author makes no representations as to the accuracy, completeness, or suitability of this information. FXStreet and the author will not be liable for any errors, omissions or any losses, injuries or damages arising from this information and its display or use. Errors and omissions excepted.

The author and FXStreet are not registered investment advisors and nothing in this article is intended to be investment advice.

Recommended Content


Recommended Content

Editors’ Picks

EUR/USD regains traction, recovers above 1.0700

EUR/USD regains traction, recovers above 1.0700

EUR/USD regained its traction and turned positive on the day above 1.0700 in the American session. The US Dollar struggles to preserve its strength after the data from the US showed that the economy grew at a softer pace than expected in Q1.

EUR/USD News

GBP/USD returns to 1.2500 area in volatile session

GBP/USD returns to 1.2500 area in volatile session

GBP/USD reversed its direction and recovered to 1.2500 after falling to the 1.2450 area earlier in the day. Although markets remain risk-averse, the US Dollar struggles to find demand following the disappointing GDP data.

GBP/USD News

Gold climbs above $2,340 following earlier drop

Gold climbs above $2,340 following earlier drop

Gold fell below $2,320 in the early American session as US yields shot higher after the data showed a significant increase in the US GDP price deflator in Q1. With safe-haven flows dominating the markets, however, XAU/USD reversed its direction and rose above $2,340.

Gold News

XRP extends its decline, crypto experts comment on Ripple stablecoin and benefits for XRP Ledger

XRP extends its decline, crypto experts comment on Ripple stablecoin and benefits for XRP Ledger

Ripple extends decline to $0.52 on Thursday, wipes out weekly gains. Crypto expert asks Ripple CTO how the stablecoin will benefit the XRP Ledger and native token XRP. 

Read more

After the US close, it’s the Tokyo CPI

After the US close, it’s the Tokyo CPI

After the US close, it’s the Tokyo CPI, a reliable indicator of the national number and then the BoJ policy announcement. Tokyo CPI ex food and energy in Japan was a rise to 2.90% in March from 2.50%.

Read more

Majors

Cryptocurrencies

Signatures