Gold Price Forecast: XAU/USD holds ground around $3,300 amid optimistic markets

XAU/USD Current price: $3,330.35
- Speculative interest welcomed softer-than-anticipated US inflation figures.
- US President Donald Trump claimed a trade deal with China is “done.”
- XAU/USD extends its consolidative phase, buyers willing to add on dips.
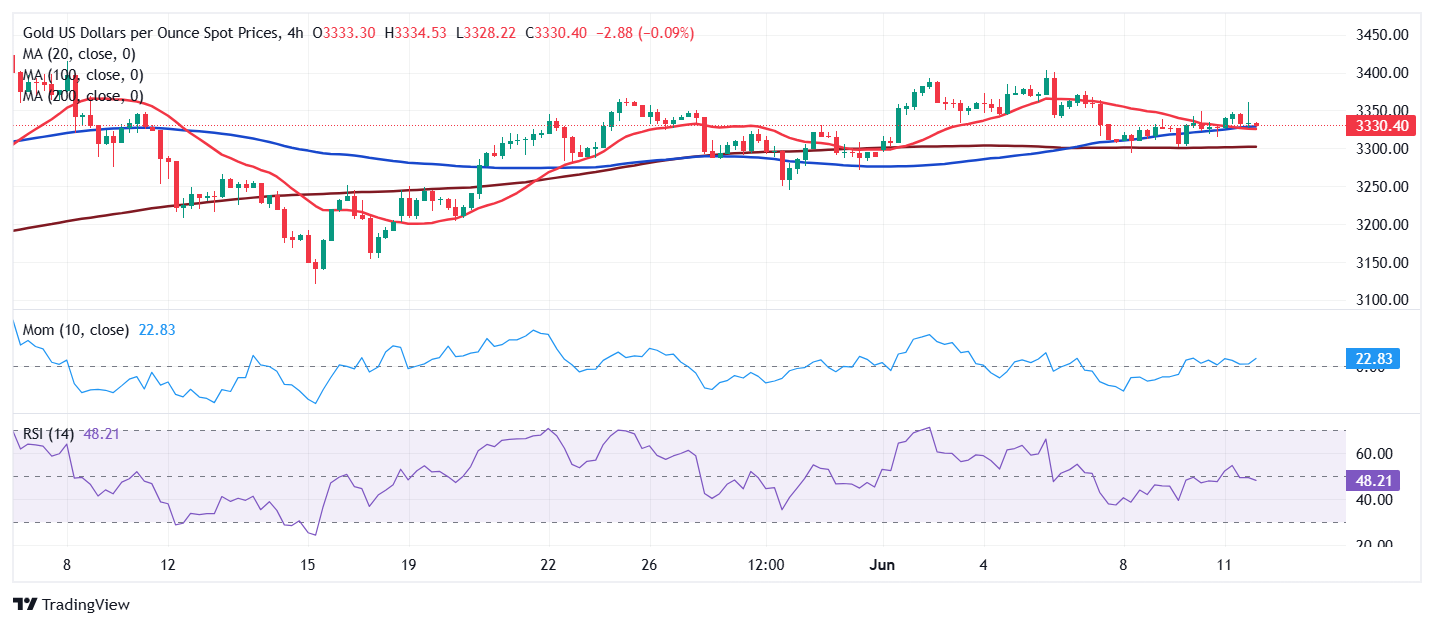
Gold is in consolidative mode on Wednesday, hovering around the $3,300 level in the mid-American session. The XAU/USD pair peaked at $3,360.72 following some interesting headlines coming from the United States (US).
On the one hand, US President Donald Trump used Truth Social to announce that the US relationship with China is “excellent,” adding that the trade deal is done but subject to Xi’s approval. On the other hand, inflation in the country, as measured by the Consumer Price Index (CPI) rose by less than anticipated in May, up by 0.1% on a monthly basis and by 2.4% from a year earlier vs the expected 0.2% and 2.5% respectively.
The US Dollar (USD) fell with the combined headlines, pushing the bright metal towards the mentioned high, yet the same optimistic news sent investors into riskier assets, to the detriment of XAU/USD.
XAU/USD short-term technical outlook
From a technical point of view, the daily chart for the XAU/USD pair shows it remains little changed for a third consecutive day. The pair keeps holding above a mildly bullish 20 Simple Moving Average (SMA), providing dynamic support at around $3,310. At the same time, the 100 and 200 SMAs extend their advances below the shorter one, in line with the dominant bullish trend and despite the limited momentum. Finally, technical indicators are stuck around their midlines without clear directional strength, reflecting the ongoing consolidation.
The 4-hour chart gives no clear directional clues. The XAU/USD pair is resting just above a bearish 20 SMA (Simple Moving Average), which converges with a mildly bullish 100 SMA. The 200 SMA, in the meantime, maintains its modest downward slope below the shorter ones. Finally, technical indicators head nowhere within neutral levels, reflecting the absence of a clear directional trend.
Support levels: 3,312.00 3,300.00 3,287.45
Resistance levels: 3,349.50 3,361.95 3,375.80
Author

Valeria Bednarik
FXStreet
Valeria Bednarik was born and lives in Buenos Aires, Argentina. Her passion for math and numbers pushed her into studying economics in her younger years.

















